
Page 31 - Analytical method for food addtives
P. 31
15
10
Results for samples compare with HPLC data for these samples
mg/L
ng/mL
% at 8
Detection limit 3.5
SD 0.8
mg/L
Calibration graph linear up to 40
ng/mL
ng/mL
Linear range 15–500
%
% for 150
Recovery 94–105
RSD 2.8
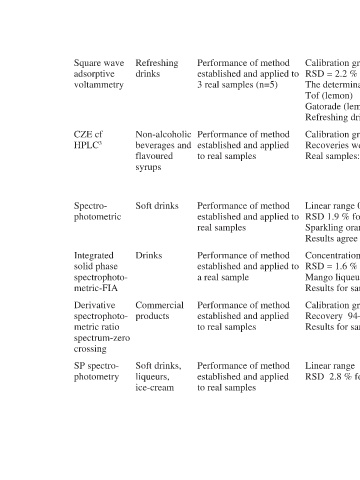
Performance of method 21 µg/L Calibration graph linear in the range 5–90 µg/L (n=10) in the same day. RSD = 2.2 % for a solution of 30 established and applied to µg/L The determination limit was 5 3 real samples (n=5) (n=5) µg/L 192±4 Tof (lemon) (n=5) µg/L 5790±116 Gatorade (lemon) (n=5) µg/L 2142±42 Refreshing drink (orange)
Performance of method
Performance of method
established and applied
established and applied
to real samples
Refreshing drinks Non-alcoholic beverages and flavoured syrups Soft drinks Drinks Commercial products Soft drinks, liqueurs, ice-cream
Square wave adsorptive voltammetry CZE cf HPLC 3 Spectro- photometric Integrated solid phase spectrophoto- metric-FIA Derivative spectrophoto- metric ratio spectrum-zero crossing SP spectro- photometry