
Page 34 - Analytical method for food addtives
P. 34
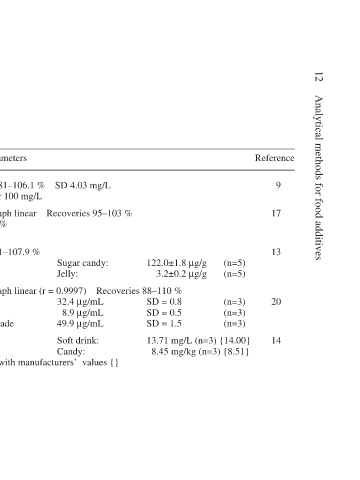
12  Analytical methods for food additives


                               Reference  9  17  13      20     14


                                                  (n=5)  (n=5)  (n=3)  (n=3)  (n=3)


                                                  µg/g  µg/g    mg/L (n=3) {14.00}  mg/kg (n=3) {8.51}
                                                  122.0±1.8  3.2±0.2  %  SD = 0.8  SD = 0.5  SD = 1.5  13.71  8.45


                                         %             Recoveries 88–110

                                    mg/L                 µg/mL  µg/mL  µg/mL
                                    SD 4.03  Recoveries 95–103  Sugar candy:  Jelly:  32.4  8.9  49.9  Soft drink:  Candy:


                                    %  mg/L     %      Calibration graph linear (r = 0.9997)  Results agree with manufacturers’  values {}
                               Statistical parameters  Recovery  93.81–106.1  % for 100 RSD 4.0  Calibration graph linear  % RSD  2.2–5.8  Recovery  92.1–107.9  Real samples:  Orange juice  Fruit juice  Merida orangeade  Real samples:


                               Extent of validation  Performance of method established on standards  Performance of method  established and applied  to a soft drink sample  Method applied to 2 real  samples (n=5)  Method applied to 3  commercial products  (n=3)  Method applied to 2 real  samples (n=3)


                               Matrix  Commercial  dyes  Beverages  First derivative Confectionery  products  Soft drinks  Candy and  carbonated  drinks

                           Table 1.2 cont’d  Method  Spectro-  photometric  CZE  spectro-  photometry  Ratio  derivative  voltammetry  Simultaneous  spectro-  photometry