
Page 253 - Antennas for Base Stations in Wireless Communications
P. 253
226 Chapter Six
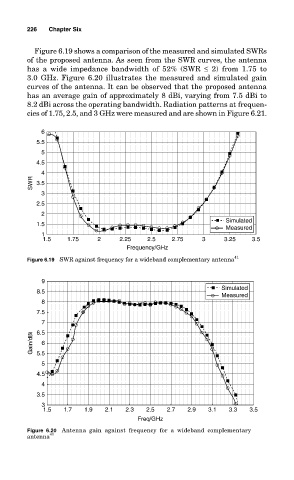
Figure 6.19 shows a comparison of the measured and simulated SWRs
of the proposed antenna. As seen from the SWR curves, the antenna
has a wide impedance bandwidth of 52% (SWR ≤ 2) from 1.75 to
3.0 GHz. Figure 6.20 illustrates the measured and simulated gain
curves of the antenna. It can be observed that the proposed antenna
has an average gain of approximately 8 dBi, varying from 7.5 dBi to
8.2 dBi across the operating bandwidth. Radiation patterns at frequen-
cies of 1.75, 2.5, and 3 GHz were measured and are shown in Figure 6.21.
6
5.5
5
4.5
4
SWR 3.5
3
2.5
2
Simulated
1.5
Measured
1
1.5 1.75 2 2.25 2.5 2.75 3 3.25 3.5
Frequency/GHz
Figure 6.19 SWR against frequency for a wideband complementary antenna 41
9
Simulated
8.5
Measured
8
7.5
7
6.5
Gain/dBi 5.5 6
5
4.5
4
3.5
3
1.5 1.7 1.9 2.1 2.3 2.5 2.7 2.9 3.1 3.3 3.5
Freq/GHz
Figure 6.20 Antenna gain against frequency for a wideband complementary
antenna 41