
Page 85 - Anthropometry, Apparel Sizing and Design
P. 85
114 Anthropometry, Apparel Sizing and Design
Table 4.8 Profile of upper body types for female 13–17
Node Body type Classified rule n5
1 and 3 Small Bust girth 86.3cm and height 153.9cm 109
1 and 4 Medium Bust girth 86.3cm and height 153.9cm 98
2 Large Bust girth 86.3cm 78
S
Height (cm) 160 M160-70 M160-76 M160-82 L160-88 L160-94 M small
M154-82
L154-88
M154-70
M154-76
medium
L154-94
154
L
large
S148-70
S148-82
L148-88
S148-76
L148-94
148
142
138
70 76 82 88 94 100
Bust girth (cm)
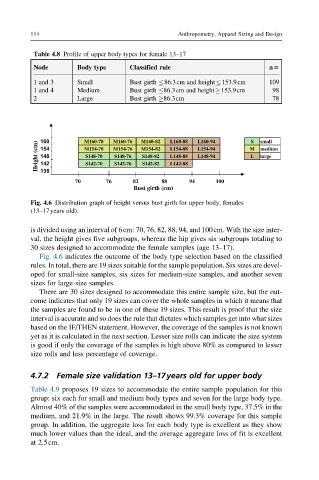
Fig. 4.6 Distribution graph of height versus bust girth for upper body, females
(13–17years old).
is divided using an interval of 6cm: 70, 76, 82, 88, 94, and 100cm. With the size inter-
val, the height gives five subgroups, whereas the hip gives six subgroups totaling to
30 sizes designed to accommodate the female samples (age 13–17).
Fig. 4.6 indicates the outcome of the body type selection based on the classified
rules. In total, there are 19 sizes suitable for the sample population. Six sizes are devel-
oped for small-size samples, six sizes for medium-size samples, and another seven
sizes for large-size samples.
There are 30 sizes designed to accommodate this entire sample size, but the out-
come indicates that only 19 sizes can cover the whole samples in which it means that
the samples are found to be in one of these 19 sizes. This result is proof that the size
interval is accurate and so does the rule that dictates which samples get into what sizes
based on the IF/THEN statement. However, the coverage of the samples is not known
yet as it is calculated in the next section. Lesser size rolls can indicate the size system
is good if only the coverage of the samples is high above 80% as compared to lesser
size rolls and less percentage of coverage.
4.7.2 Female size validation 13–17years old for upper body
Table 4.9 proposes 19 sizes to accommodate the entire sample population for this
group: six each for small and medium body types and seven for the large body type.
Almost 40% of the samples were accommodated in the small body type, 37.5% in the
medium, and 21.9% in the large. The result shows 99.3% coverage for this sample
group. In addition, the aggregate loss for each body type is excellent as they show
much lower values than the ideal, and the average aggregate loss of fit is excellent
at 2.5cm.