
Page 81 - Anthropometry, Apparel Sizing and Design
P. 81
110 Anthropometry, Apparel Sizing and Design
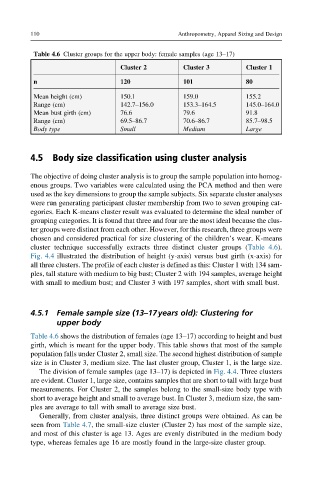
Table 4.6 Cluster groups for the upper body: female samples (age 13–17)
Cluster 2 Cluster 3 Cluster 1
n 120 101 80
Mean height (cm) 150.1 159.0 155.2
Range (cm) 142.7–156.0 153.3–164.5 145.0–164.0
Mean bust girth (cm) 76.6 79.6 91.8
Range (cm) 69.5–86.7 70.6–86.7 85.7–98.5
Body type Small Medium Large
4.5 Body size classification using cluster analysis
The objective of doing cluster analysis is to group the sample population into homog-
enous groups. Two variables were calculated using the PCA method and then were
used as the key dimensions to group the sample subjects. Six separate cluster analyses
were run generating participant cluster membership from two to seven grouping cat-
egories. Each K-means cluster result was evaluated to determine the ideal number of
grouping categories. It is found that three and four are the most ideal because the clus-
ter groups were distinct from each other. However, for this research, three groups were
chosen and considered practical for size clustering of the children’s wear. K-means
cluster technique successfully extracts three distinct cluster groups (Table 4.6).
Fig. 4.4 illustrated the distribution of height (y-axis) versus bust girth (x-axis) for
all three clusters. The profile of each cluster is defined as this: Cluster 1 with 134 sam-
ples, tall stature with medium to big bust; Cluster 2 with 194 samples, average height
with small to medium bust; and Cluster 3 with 197 samples, short with small bust.
4.5.1 Female sample size (13–17years old): Clustering for
upper body
Table 4.6 shows the distribution of females (age 13–17) according to height and bust
girth, which is meant for the upper body. This table shows that most of the sample
population falls under Cluster 2, small size. The second highest distribution of sample
size is in Cluster 3, medium size. The last cluster group, Cluster 1, is the large size.
The division of female samples (age 13–17) is depicted in Fig. 4.4. Three clusters
are evident. Cluster 1, large size, contains samples that are short to tall with large bust
measurements. For Cluster 2, the samples belong to the small-size body type with
short to average height and small to average bust. In Cluster 3, medium size, the sam-
ples are average to tall with small to average size bust.
Generally, from cluster analysis, three distinct groups were obtained. As can be
seen from Table 4.7, the small-size cluster (Cluster 2) has most of the sample size,
and most of this cluster is age 13. Ages are evenly distributed in the medium body
type, whereas females age 16 are mostly found in the large-size cluster group.