
Page 76 - Anthropometry, Apparel Sizing and Design
P. 76
Developing apparel sizing system using anthropometric data 105
(Field, 2005; Hsu et al., 2007). Parsimonious means the variation of body dimensions
are described using the fewest principal components (PCs) possible (Salusso-Deonier
et al., 1985).
4.4.3 The results of components analysis
The results of the extracted components for each sample group are recorded. In gen-
eral, 50 components are extracted from each sample group to explain 100% of the
variance in the data. The summarization of variables proves to be very good as the
number of principal components is the same with the number of original variables.
This indicates that the original information is not neglected as a variation factor
(Salusso-Deonier et al., 1985).
According to Hair et al. (1998) the first few components should extract at least 50%
of the variance to prove the usefulness of PCA technique. The study shows that female
samples between 13 and 17, with less percentage value, are observed, at 54%. Thus
this result indicates variance of >50% in the first component. This indicates that PCA
technique is an effective method for this study to obtain a parsimonious solution in
describing the variations of body shapes in this sample group.
Furthermore, the extracted factor should at least be 90% of the explained variance
to show efficiency (Hair et al, 1998; Salusso-Deonier and DeLong, 1982). From this
finding, 90% variance was explained by fourteen principal components for female
samples age between 13 and 17. In contrast, study conducted by Hsu et al. (2006)
shows that only 60% of total variance for 15 components are found in the study, which
is considered low. However, in 2006, the same researcher improved her studies by
obtaining a 60% total variance accounted for two components (Gupta and
Gangadhar, 2004).
To reduce the numbers of components for a more parsimonious solution, the cri-
terion of retaining components is applied, which are latent root, scree plot, and per-
centage of accumulated variance. Table 4.4 showed all the components that have been
extracted with an eigenvalue greater than one (with bold values), which implies that
these components are suitable to be retained.
For the female population aged between 13 and 17years old, the result is shown in
Table 4.4. In this table, six components (Components 1, 2, 3, 4, 5, and 6) show an
eigenvalue >1. The first component shows eigenvalue of 27.0% followed by 7.5%,
2.0%, 1.9%,1.1%, and 1.0% in which the total rotation sums of squared loadings
account for 81.1%.
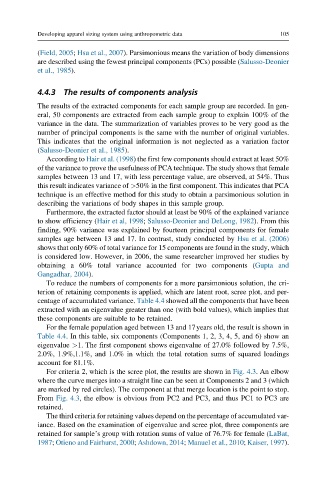
For criteria 2, which is the scree plot, the results are shown in Fig. 4.3. An elbow
where the curve merges into a straight line can be seen at Components 2 and 3 (which
are marked by red circles). The component at that merge location is the point to stop.
From Fig. 4.3, the elbow is obvious from PC2 and PC3, and thus PC1 to PC3 are
retained.
The third criteria for retaining values depend on the percentage of accumulated var-
iance. Based on the examination of eigenvalue and scree plot, three components are
retained for sample’s group with rotation sums of value of 76.7% for female (LaBat,
1987; Otieno and Fairhurst, 2000; Ashdown, 2014; Manuel et al., 2010; Kaiser, 1997).