
Page 77 - Anthropometry, Apparel Sizing and Design
P. 77
106 Anthropometry, Apparel Sizing and Design
Table 4.4 Principal component analysis extraction for female (LaBat, 1987; Otieno and
Fairhurst, 2000; Ashdown, 2014; Manuel et al., 2010; Kaiser, 1997)
Rotation sums of squared
Initial eigenvalues loadings
%of Cumulative %of Cumulative
Component Total variance % variance %
1 27.0 54.0 54.0 39.3 39.3
2 7.5 15.0 69.0 20.8 60.0
3 2.0 4.1 73.1 7.5 67.6
4 1.9 3.7 76.9 6.6 74.1
5 1.1 2.3 79.1 3.6 77.8
6 1.0 2.0 81.1 3.4 81.1
Scree plot for female (13-17)
30
25
20
Eigenvalue 15
10
5
0
1 23456789 11111111112222222222333333333344444444445
0 1 2 3 4 5 6 7 8 9 0 1 23456789 0 1 23456789 0 1 234567890
Component number
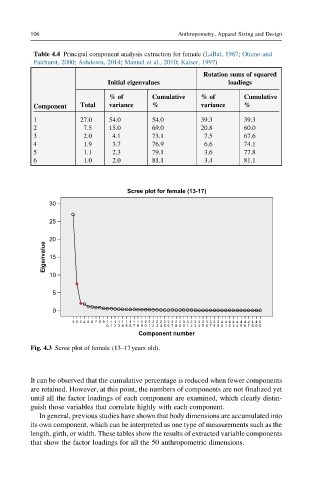
Fig. 4.3 Scree plot of female (13–17years old).
It can be observed that the cumulative percentage is reduced when fewer components
are retained. However, at this point, the numbers of components are not finalized yet
until all the factor loadings of each component are examined, which clearly distin-
guish those variables that correlate highly with each component.
In general, previous studies have shown that body dimensions are accumulated into
its own component, which can be interpreted as one type of measurements such as the
length, girth, or width. These tables show the results of extracted variable components
that show the factor loadings for all the 50 anthropometric dimensions.