
Page 82 - Anthropometry, Apparel Sizing and Design
P. 82
Developing apparel sizing system using anthropometric data 111
Height
Bust girth
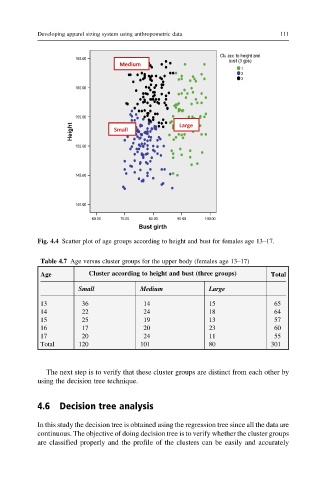
Fig. 4.4 Scatter plot of age groups according to height and bust for females age 13–17.
Table 4.7 Age versus cluster groups for the upper body (females age 13–17)
Age Cluster according to height and bust (three groups) Total
Small Medium Large
13 36 14 15 65
14 22 24 18 64
15 25 19 13 57
16 17 20 23 60
17 20 24 11 55
Total 120 101 80 301
The next step is to verify that these cluster groups are distinct from each other by
using the decision tree technique.
4.6 Decision tree analysis
In this study the decision tree is obtained using the regression tree since all the data are
continuous. The objective of doing decision tree is to verify whether the cluster groups
are classified properly and the profile of the clusters can be easily and accurately