
Page 86 - Anthropometry, Apparel Sizing and Design
P. 86
Developing apparel sizing system using anthropometric data 115
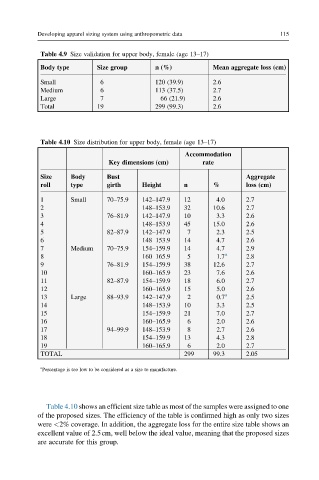
Table 4.9 Size validation for upper body, female (age 13–17)
Body type Size group n (%) Mean aggregate loss (cm)
Small 6 120 (39.9) 2.6
Medium 6 113 (37.5) 2.7
Large 7 66 (21.9) 2.6
Total 19 299 (99.3) 2.6
Table 4.10 Size distribution for upper body, female (age 13–17)
Accommodation
Key dimensions (cm) rate
Size Body Bust Aggregate
roll type girth Height n % loss (cm)
1 Small 70–75.9 142–147.9 12 4.0 2.7
2 148–153.9 32 10.6 2.7
3 76–81.9 142–147.9 10 3.3 2.6
4 148–153.9 45 15.0 2.6
5 82–87.9 142–147.9 7 2.3 2.5
6 148–153.9 14 4.7 2.6
7 Medium 70–75.9 154–159.9 14 4.7 2.9
8 160–165.9 5 1.7 a 2.8
9 76–81.9 154–159.9 38 12.6 2.7
10 160–165.9 23 7.6 2.6
11 82–87.9 154–159.9 18 6.0 2.7
12 160–165.9 15 5.0 2.6
13 Large 88–93.9 142–147.9 2 0.7 a 2.5
14 148–153.9 10 3.3 2.5
15 154–159.9 21 7.0 2.7
16 160–165.9 6 2.0 2.6
17 94–99.9 148–153.9 8 2.7 2.6
18 154–159.9 13 4.3 2.8
19 160–165.9 6 2.0 2.7
TOTAL 299 99.3 2.05
a
Percentage is too low to be considered as a size to manufacture.
Table 4.10 shows an efficient size table as most of the samples were assigned to one
of the proposed sizes. The efficiency of the table is confirmed high as only two sizes
were <2% coverage. In addition, the aggregate loss for the entire size table shows an
excellent value of 2.5cm, well below the ideal value, meaning that the proposed sizes
are accurate for this group.