
Page 75 - Anthropometry, Apparel Sizing and Design
P. 75
104 Anthropometry, Apparel Sizing and Design
categories. All the methods described earlier are based on a linear structure that has an
advantage of easy grading and size labeling (O’Brien and Shelton, 1941). Multivariate
analysis—specifically the PCA technique—is still widely used by many researchers to
detect the relationships between variables and in turn find key dimensions by which to
classify the population (Chung et al., 2007; Hsu et al., 2006; Gupta and Gangadhar,
2004). PCA was also used to identify the key dimensions for the population (Chung
and Wang, 2006). They classified each population according to key dimensions using
simple univariate analysis. Height dimension resulted in three height ranges, and bust
girth gave six bust ranges. For this chapter, only one group of anthropometric data is
used to show how key dimensions were selected using PCA method. The data used
here are the male and female 13–17years old
4.4.1 Multivariate data examination
There are two main measurements conducted in this section prior to PCA, namely, the
validity and percentile analysis. All the 50 body dimensions taken from the samples
(female age 13–17) are tested for validity and reliability. These measurements are exam-
ined prior to PCA. Bartlett’s test of sphericity and Kaiser-Meyer-Olkin (KMO) test are
performed to ensure the adequacy of sampling for PCA analysis. In addition, Cronbach’s
alpha is used to determine the consistency and unidimensionality of the data.
The KMO result shows all values are >0.9, and Bartlett’s test of sphericity is highly
significant since the observed significance level is 0.0000 (P<.005). For factor analysis,
KMO is supposed to be >.5 and Bartlett test <.05. As shown in Table 4.3,KMO values
are 0.973 for male (LaBat, 1987; Otieno and Fairhurst, 2000; Ashdown, 2014; Manuel
et al., 2010; Kaiser, 1997) and 0.965 for female (LaBat, 1987; Otieno and Fairhurst,
2000; Ashdown, 2014; Manuel et al., 2010; Kaiser, 1997). According to Raykov
(Raykov and Marcoulides, 2008), KMO >0.9 falls into the range of superb or marvelous.
Thus it can be concluded that the relationship between the variables is very strong and
factor analysis can be carried out. In addition, the results also confirm that the data show
sampling adequacy, which means it is likely to factor well for PCA analysis.
4.4.2 Principal component analysis (PCA)
The body dimensions of each sample group are extracted using PCA and varimax rota-
tion. This is a common technique applied on anthropometric data to describe varia-
tions in human body in a parsimonious manner by many previous sizing studies
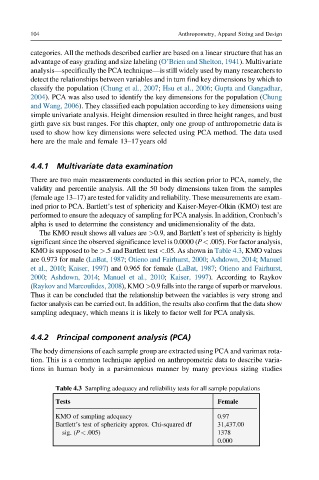
Table 4.3 Sampling adequacy and reliability tests for all sample populations
Tests Female
KMO of sampling adequacy 0.97
Bartlett’s test of sphericity approx. Chi-squared df 31,437.00
sig. (P<.005) 1378
0.000