
Page 104 - Applied Process Design For Chemical And Petrochemical Plants Volume III
P. 104
66131_Ludwig_CH10B 5/30/2001 4:18 PM Page 72
72 Applied Process Design for Chemical and Petrochemical Plants
Subscripts: cor Corrected for determining exchanger area
requirements.
calc Calculated from Equation 10-13.
Use (LMTD) cor in determining exchanger area require-
T 2
ments.
T 3
∆T 1
Q
A o Q>1U T m 2 (10-16)
t 1
∆T 2
U1LMTD2 cor
T 4
t 2
∆T 3
A o Required effective outside heat transfer surface area
t 4 based on net exposed tube area. Note: Later in text A o
t 3
A.
T m Corrected mean temperature difference.
Q 1 or A 1 Q 2 or A 2 Q 3 or A 3
U Overall heat transfer (fouled) coefficient, Equation
Total Heat Transfer, Btu 10-37
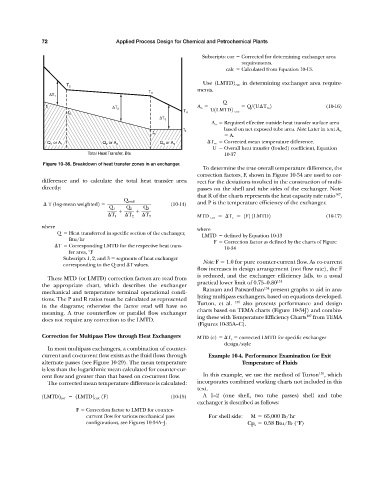
Figure 10-36. Breakdown of heat transfer zones in an exchanger.
To determine the true overall temperature difference, the
correction factors, F, shown in Figure 10-34 are used to cor-
difference and to calculate the total heat transfer area rect for the deviations involved in the construction of multi-
directly: passes on the shell and tube sides of the exchanger. Note
107
that R of the charts represents the heat capacity rate ratio ,
Q total
T 1log-mean weighted2 (10-14) and P is the temperature efficiency of the exchanger.
Q 1 Q 2 Q 3
T 1 T 2 T 3 MTD cor T c 1F2 1LMTD2 (10-17)
where
where
Q Heat transferred in specific section of the exchanger,
LMTD defined by Equation 10-13
Btu/hr
F Correction factor as defined by the charts of Figure
T Corresponding LMTD for the respective heat trans-
10-34
fer area, °F
Subscripts 1, 2, and 3 segments of heat exchanger
Note: F 1.0 for pure counter-current flow. As co-current
corresponding to the Q and T values.
flow increases in design arrangement (not flow rate), the F
is reduced, and the exchanger efficiency falls, to a usual
These MTD (or LMTD) correction factors are read from
practical lower limit of 0.75—0.80 131
the appropriate chart, which describes the exchanger
Ratnam and Patwardhan 134 present graphs to aid in ana-
mechanical and temperature terminal operational condi-
lyzing multipass exchangers, based on equations developed.
tions. The P and R ratios must be calculated as represented
Turton, et al. 135 also presents performance and design
in the diagrams; otherwise the factor read will have no
charts based on TEMA charts (Figure 10-34J) and combin-
meaning. A true counterflow or parallel flow exchanger
ing these with Temperature Efficiency Charts 107 from TEMA
does not require any correction to the LMTD.
(Figures 10-35A—C).
Correction for Multipass Flow through Heat Exchangers MTD (c) T c corrected LMTD for specific exchanger
design/style
In most multipass exchangers, a combination of counter-
current and co-current flow exists as the fluid flows through Example 10-4. Performance Examination for Exit
alternate passes (see Figure 10-29). The mean temperature Temperature of Fluids
is less than the logarithmic mean calculated for counter-cur-
135
rent flow and greater than that based on co-current flow. In this example, we use the method of Turton , which
The corrected mean temperature difference is calculated: incorporates combined working charts not included in this
text.
1LMTD2 cor 1LMTD2 calc 1F2 (10-15) A 1—2 (one shell, two tube passes) shell and tube
exchanger is described as follows:
F Correction factor to LMTD for counter-
current flow for various mechanical pass For shell side: M 65,000 lb/hr
configurations, see Figures 10-34A—J. Cp s 0.58 Btu/lb (°F)