
Page 245 -
P. 245
Gas and Liquid Injection Rates 207
2500
Bottomhole Pressure (psia) 2000 Gas Mud
1500
1000
Mud flow rate 200gpm
100
90
Flowing 500 Rate: Rate: Mud flow rate 100gpm
Mud flow rate 300gpm
200
200
Mud flow rate 400gpm
300
380
Balanced pressure
0 720 400
0 500 1000 1500 2000
Air Injection Rate (scfm)
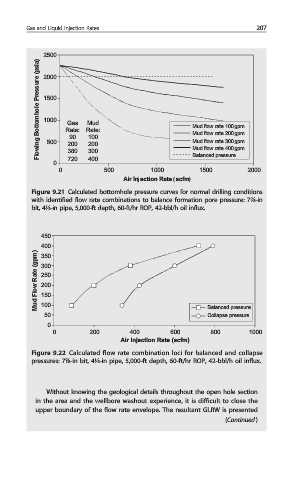
Figure 9.21 Calculated bottomhole pressure curves for normal drilling conditions
with identified flow rate combinations to balance formation pore pressure: 7⅞-in
bit, 4½-in pipe, 5,000-ft depth, 60-ft/hr ROP, 42-bbl/h oil influx.
450
400
Mud Flow Rate (gpm) 300
350
250
200
150
100
50 Balanced pressure
Collapse pressure
0
0 200 400 600 800 1000
Air Injection Rate (scfm)
Figure 9.22 Calculated flow rate combination loci for balanced and collapse
pressures: 7⅞-in bit, 4½-in pipe, 5,000-ft depth, 60-ft/hr ROP, 42-bbl/h oil influx.
Without knowing the geological details throughout the open hole section
in the area and the wellbore washout experience, it is difficult to close the
upper boundary of the flow rate envelope. The resultant GLRW is presented
(Continued )