
Page 121 - Applied Petroleum Geomechanics
P. 121
Rock strengths and rock failure criteria 113
(A)
(B)
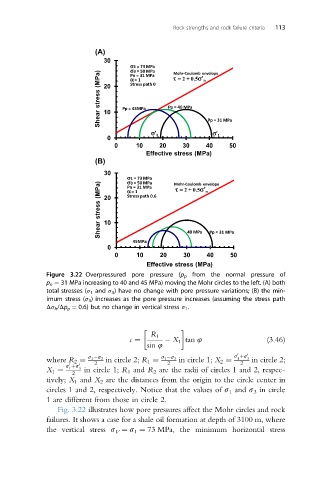
Figure 3.22 Overpressured pore pressure (p p from the normal pressure of
p n ¼ 31 MPa increasing to 40 and 45 MPa) moving the Mohr circles to the left. (A) both
total stresses (s 1 and s 3 ) have no change with pore pressure variations; (B) the min-
imum stress (s 3 ) increases as the pore pressure increases (assuming the stress path
Ds h /Dp p ¼ 0.6) but no change in vertical stress s 1 .
R 1
c ¼ X 1 tan 4 (3.46)
sin 4
0
s þs 0
s 1 s 3 s 1 s 3 1 3
where R 2 ¼ 2 in circle 2; R 1 ¼ 2 in circle 1; X 2 ¼ 2 in circle 2;
s þs 0
0
X 1 ¼ 1 3 in circle 1; R 1 and R 2 are the radii of circles 1 and 2, respec-
2
tively; X 1 and X 2 are the distances from the origin to the circle center in
circles 1 and 2, respectively. Notice that the values of s 1 and s 3 in circle
1 are different from those in circle 2.
Fig. 3.22 illustrates how pore pressures affect the Mohr circles and rock
failures. It shows a case for a shale oil formation at depth of 3100 m, where
the vertical stress s V ¼ s 1 ¼ 73 MPa, the minimum horizontal stress