
Page 131 - Applied Petroleum Geomechanics
P. 131
Rock strengths and rock failure criteria 123
s 1 þs 2 þs 3
where s oct ¼ s m ¼ . It can be seen that the DruckerePrager crite-
3
rion, Eq. (3.52), is a specific form of Eq. (3.65)
Mogi (1971) plotted his experimental data for the Dunham dolomite
and the Mizuho trachyte and found that s oct and s m,2 have a single
monotonically rising curve for each rock, i.e.,
s oct ¼ g 1 ðs m;2 Þ (3.66)
s 1 þs 3
where s m;2 ¼
2
Eq. (3.66) was used to fit the KTB amphibolite and the Westerly granite
as a monotonically increasing power function (Haimson and Chang, 2000;
Haimson, 2006) as the following form:
s oct ¼ As B (3.67)
m;2
where A and B are the fitting parameters. If the stress unit is in MPa, then
for the KTB amphibolite the parameters are A ¼ 1.77 and B ¼ 0.86; for
the Westerly granite A ¼ 1.51 and B ¼ 0.89 (Haimson, 2006).
Alternately, the linear Mogi model can be used for true triaxial data of
rocks, which also provides a good fit and is easier to use:
(3.68)
s oct ¼ a þ bs m;2
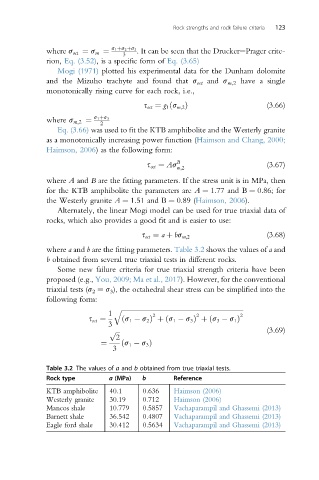
where a and b are the fitting parameters. Table 3.2 shows the values of a and
b obtained from several true triaxial tests in different rocks.
Some new failure criteria for true triaxial strength criteria have been
proposed (e.g., You, 2009; Ma et al., 2017). However, for the conventional
triaxial tests (s 2 ¼ s 3 ), the octahedral shear stress can be simplified into the
following form:
1 q ffiffiffiffiffiffiffiffiffiffiffiffiffiffiffiffiffiffiffiffiffiffiffiffiffiffiffiffiffiffiffiffiffiffiffiffiffiffiffiffiffiffiffiffiffiffiffiffiffiffiffiffiffiffiffiffiffiffiffiffiffiffiffiffiffiffiffiffiffiffiffiffi 2
2
2
s oct ¼ ðs 1 s 2 Þ þðs 1 s 3 Þ þðs 3 s 1 Þ
3
p ffiffiffi (3.69)
2
¼ ðs 1 s 3 Þ
3
Table 3.2 The values of a and b obtained from true triaxial tests.
Rock type a (MPa) b Reference
KTB amphibolite 40.1 0.636 Haimson (2006)
Westerly granite 30.19 0.712 Haimson (2006)
Mancos shale 10.779 0.5857 Vachaparampil and Ghassemi (2013)
Barnett shale 36.542 0.4807 Vachaparampil and Ghassemi (2013)
Eagle ford shale 30.412 0.5634 Vachaparampil and Ghassemi (2013)