
Page 118 - Applied Photovoltaics
P. 118
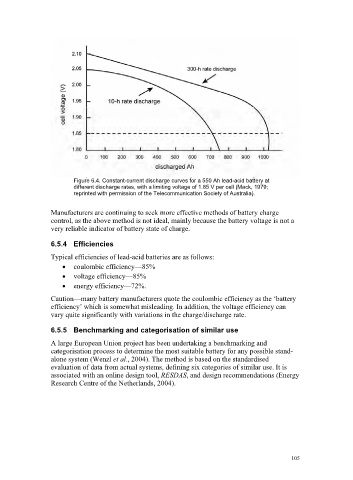
Figure 6.4. Constant-current discharge curves for a 550 Ah lead-acid battery at
                                 different discharge rates, with a limiting voltage of 1.85 V per cell (Mack, 1979;
                                 reprinted with permission of the Telecommunication Society of Australia).

                          Manufacturers are continuing to seek more effective methods of battery charge
                          control, as the above method is not ideal, mainly because the battery voltage is not a
                          very reliable indicator of battery state of charge.

                          6.5.4 Efficiencies
                          Typical efficiencies of lead-acid batteries are as follows:
                              x  coulombic efficiency—85%
                              x  voltage efficiency—85%
                              x  energy efficiency—72%.

                          Caution—many battery manufacturers quote the coulombic efficiency as the ‘battery
                          efficiency’ which is somewhat misleading. In addition, the voltage efficiency can
                          vary quite significantly with variations in the charge/discharge rate.
                          6.5.5  Benchmarking and categorisation of similar use

                          A large European Union project has been undertaking a benchmarking and
                          categorisation process to determine the most suitable battery for any possible stand-
                          alone system (Wenzl et al., 2004). The method is based on the standardised
                          evaluation of data from actual systems, defining six categories of similar use. It is
                          associated with an online design tool, RESDAS, and design recommendations (Energy
                          Research Centre of the Netherlands, 2004).


                                                                                                105