
Page 173 - Applied Probability
P. 173
8. The Polygenic Model
158
2
1
♦
3 4 5 6 7 8 9 10
♦ ♦
11 12
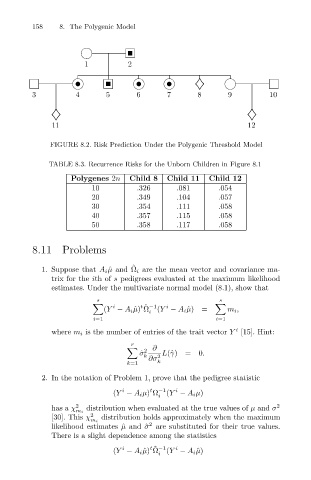
FIGURE 8.2. Risk Prediction Under the Polygenic Threshold Model
TABLE 8.3. Recurrence Risks for the Unborn Children in Figure 8.1
Polygenes 2n Child 8 Child 11 Child 12
10 .326 .081 .054
20 .349 .104 .057
30 .354 .111 .058
40 .357 .115 .058
50 .358 .117 .058
8.11 Problems
ˆ
1. Suppose that A i ˆ µ and Ω i are the mean vector and covariance ma-
trix for the ith of s pedigrees evaluated at the maximum likelihood
estimates. Under the multivariate normal model (8.1), show that
s s
i t ˆ −1 i
(Y − A i ˆ µ) Ω i (Y − A i ˆ µ)= m i ,
i=1 i=1
i
where m i is the number of entries of the trait vector Y [15]. Hint:
r
2 ∂
ˆ σ k 2 L(ˆ γ)=0.
∂σ
k=1 k
2. In the notation of Problem 1, prove that the pedigree statistic
t
i
i
(Y − A i µ) Ω −1 (Y − A i µ)
i
has a χ 2 distribution when evaluated at the true values of µ and σ 2
m i
[30]. This χ 2 distribution holds approximately when the maximum
m i
2
likelihood estimates ˆµ and ˆσ are substituted for their true values.
There is a slight dependence among the statistics
i
t ˆ −1
i
(Y − A i ˆµ) Ω i (Y − A i ˆµ)