
Page 168 - Applied Probability
P. 168
1.5 2.5 2 8. The Polygenic Model 153
QTL location score 1
0.5
0
-0.5 5 10 15 20 25 30 40 45 55 60 65 70 75 80 85 90 100 105 110 120 125 130 135 140 145 150 155 160 170 175 180 190 195 205
D12S372A D12S397A D12S391A D12S373A D12S1042 D12S1090 D12S390A D12S375A D12S379A D12S393A D12S395A D12S2078 D12S1045 D12S392A
distance in centimorgans along chromosome 12
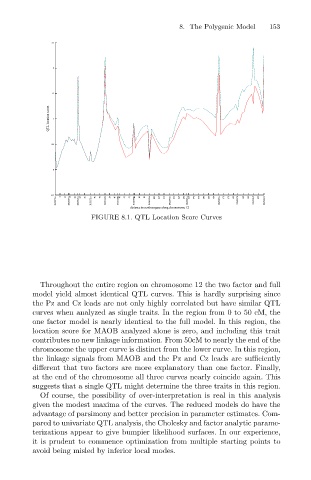
FIGURE 8.1. QTL Location Score Curves
Throughout the entire region on chromosome 12 the two factor and full
model yield almost identical QTL curves. This is hardly surprising since
the Pz and Cz leads are not only highly correlated but have similar QTL
curves when analyzed as single traits. In the region from 0 to 50 cM, the
one factor model is nearly identical to the full model. In this region, the
location score for MAOB analyzed alone is zero, and including this trait
contributes no new linkage information. From 50cM to nearly the end of the
chromosome the upper curve is distinct from the lower curve. In this region,
the linkage signals from MAOB and the Pz and Cz leads are sufficiently
different that two factors are more explanatory than one factor. Finally,
at the end of the chromosome all three curves nearly coincide again. This
suggests that a single QTL might determine the three traits in this region.
Of course, the possibility of over-interpretation is real in this analysis
given the modest maxima of the curves. The reduced models do have the
advantage of parsimony and better precision in parameter estimates. Com-
pared to univariate QTL analysis, the Cholesky and factor analytic parame-
terizations appear to give bumpier likelihood surfaces. In our experience,
it is prudent to commence optimization from multiple starting points to
avoid being misled by inferior local modes.