Page 165 - Applied Probability
P. 165

8. The Polygenic Model
                              150
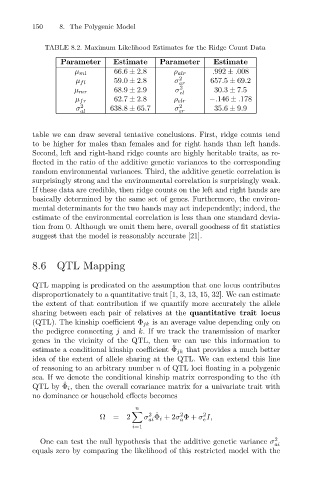
                                  TABLE 8.2. Maximum Likelihood Estimates for the Ridge Count Data
                                                                              Estimate
                                      Parameter
                                                    66.6 ± 2.8
                                                                             .992 ± .008
                                         µ ml
                                                                   ρ alr
                                                                     2
                                                                   σ
                                                    59.0 ± 2.8
                                          µ fl
                                                                     ar
                                                                     2
                                                    68.9 ± 2.9
                                                                              30.3 ± 7.5
                                                                    σ
                                         µ mr       Estimate    Parameter    657.5 ± 69.2
                                                                     el
                                          µ fr      62.7 ± 2.8     ρ elr     −.146 ± .178
                                          σ 2      638.8 ± 65.7     σ 2       35.6 ± 9.9
                                           al                        er
                              table we can draw several tentative conclusions. First, ridge counts tend
                              to be higher for males than females and for right hands than left hands.
                              Second, left and right-hand ridge counts are highly heritable traits, as re-
                              flected in the ratio of the additive genetic variances to the corresponding
                              random environmental variances. Third, the additive genetic correlation is
                              surprisingly strong and the environmental correlation is surprisingly weak.
                              If these data are credible, then ridge counts on the left and right hands are
                              basically determined by the same set of genes. Furthermore, the environ-
                              mental determinants for the two hands may act independently; indeed, the
                              estimate of the environmental correlation is less than one standard devia-
                              tion from 0. Although we omit them here, overall goodness of fit statistics
                              suggest that the model is reasonably accurate [21].
                              8.6 QTL Mapping
                              QTL mapping is predicated on the assumption that one locus contributes
                              disproportionately to a quantitative trait [1, 3, 13, 15, 32]. We can estimate
                              the extent of that contribution if we quantify more accurately the allele
                              sharing between each pair of relatives at the quantitative trait locus
                              (QTL). The kinship coefficient Φ jk is an average value depending only on
                              the pedigree connecting j and k. If we track the transmission of marker
                              genes in the vicinity of the QTL, then we can use this information to
                                                                   ˆ
                              estimate a conditional kinship coefficient Φ jk that provides a much better
                              idea of the extent of allele sharing at the QTL. We can extend this line
                              of reasoning to an arbitrary number n of QTL loci floating in a polygenic
                              sea. If we denote the conditional kinship matrix corresponding to the ith
                                      ˆ
                              QTL by Φ i , then the overall covariance matrix for a univariate trait with
                              no dominance or household effects becomes
                                                         n

                                                             2 ˆ
                                                                     2
                                                                           2
                                                Ω= 2        σ Φ i +2σ Φ+ σ I,
                                                                           e
                                                             ai
                                                                     a
                                                         i=1
                                One can test the null hypothesis that the additive genetic variance σ 2 ai
                              equals zero by comparing the likelihood of this restricted model with the
   160   161   162   163   164   165   166   167   168   169   170