
Page 148 - APPLIED PROCESS DESIGN FOR CHEMICAL AND PETROCHEMICAL PLANTS, Volume 1, 3rd Edition
P. 148
134 Applied Process Design for Chemical and Petrochemical Plants
1 .o
8
6
5
4
3
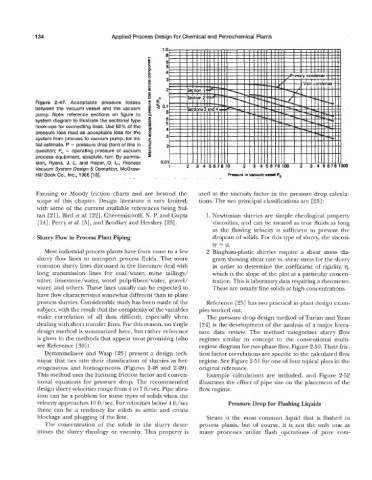
Figure 2-47. Acceptable pressure losses
between the vacuum vessel and the vacuum
pump. Note: reference sections on figure to
system diagram to illustrate the sectional type
hook-ups for connecting lines. Use 60% of the
pressure loss read as acceptable loss for the
system from process to vacuum pump, for ini-
tial estimate. P = pressure drop (torr) of line in 2
question; Po = operating pressure of vacuum
process equipment, absolute, torr. By permis-
sion, Ryans, J. L. and Roper, D. L., Process 0.011 I 1 I I IIII I IIII I I I I1111 I Ill1 I I I I1111 I1111
2
Vacuum System Design & Operation, McGraw- 1 2 3 4 567810 2 3 4 5678100 3 4 56781000
Hill Book Co., Inc., 1986 [18]. Pressure in vacuum vessel Po
Fanning or Moody friction charts and are beyond the used as the viscosity factor in the pressure drop calcula-
scope of this chapter. Design literature is very limited, tions. The two principal classifications are [25]:
with some of the current available references being Sul-
tan [21], Bird et al. [22], Cheremisinoff, N. P. and Gupta 1. Newtonian slurries are simple rheological property
[ 141, Perry et al. [5], and Brodkey and Hershey [23]. viscosities, and can be treated as true fluids as long
as the flowing velocity is sufficient to prevent the
Slurry Flow in Process Plant Piping dropout of solids. For this type of slurry, the viscosi-
ty = P.
Most industrial process plants have from none to a few 2. Bingham-plastic slurries require a shear stress dia-
slurry flow lines to transport process fluids. The more gram showing shear rate vs. shear stress for the slurry
common slurry lines discussed in the literature deal with in order to determine the coefficient of rigidity, q,
long transmission lines for coal/water, mine tailings/ which is the slope of the plot at a particular concen-
water, limestone/water, wood pulp-fibers/water, gravel/ tration. This is laboratory data requiring a rheometer.
water, and others. These lines usually can be expected to These are usually fine solids at high concentrations.
have flow characteristics somewhat different than in-plant
process slurries. Considerable study has been made of the Reference [25] has two practical in-plant design exam-
subject, with the result that the complexity of the variables ples worked out.
make correlation of all data difficult, especially when The pressure drop design method of Turian and Yuan
dealing with short transfer lines. For this reason, no single [24] is the development of the analysis of a major litera-
design method is summarized here, but rather reference ture data review. The method categorizes slurry flow
is given to the methods that appear most promising (also regimes similar in concept to the conventional multi-
see Reference [30]). regime diagram for two-phase flow, Figure 2-50. Their fric-
Derammelaere and Wasp [25] present a design tech- tion factor correlations are specific to the calculated flow
nique that ties into their classification of slurries as het- regime. See Figure 2-51 for one of four typical plots in the
erogeneous and homogeneous (Figures 2-48 and 2-49). original reference.
This method uses the Fanning friction factor and conven- Example calculations are included, and Figure 2-52
tional equations for pressure drop. The recommended illustrates the effect of pipe size on the placement of the
design slurry velocities range from 4 to '7 ft/sec. Pipe abra- flow regime.
sion can be a problem for some types of solids when the
velocity approaches 10 ft/sec. For velocities below 4 ft/sec Pressure Drop for Flashing Liquids
there can be a tendency for solids to settle and create
blockage and plugging of the line. Steam is the most common liquid that is flashed in
The concentration of the solids in the slurry deter- process plants, but of course, it is not the only one as
mines the slurry rheology or viscosity. This property is many processes utilize flash operations of pure com-