
Page 226 - APPLIED PROCESS DESIGN FOR CHEMICAL AND PETROCHEMICAL PLANTS, Volume 1, 3rd Edition
P. 226
1 98 Applied Process Design for Chemical and Petrochemical Plants
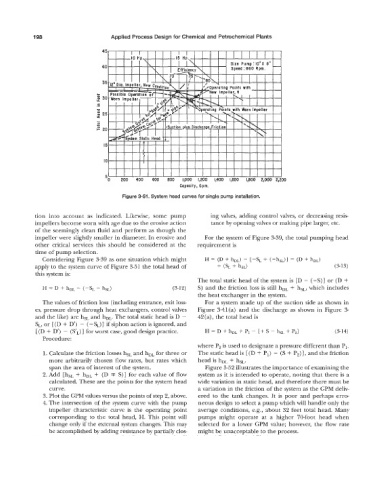
Figure 3-51. System head curves for single pump installation.
tion into account as indicated. Likewise, some pump ing valves, adding control valves, or decreasing resis-
impellers become worn with age due to the erosive action tance by opening valves or making pipe larger, etc.
of the seemingly clean fluid and perform as though the
impeller were slightly smaller in diameter. In erosive and For the system of Figure 3-39, the total pumping head
other critical services this should be considered at the requirement is
time of pump selection.
Considering Figure 3-39 as one situation which might
apply to the system curve of Figure 3-51 the total head of
this system is:
The total static head of the system is [D - (-S)] or (D +
S) and the friction loss is still h,, + h,,, which includes
the heat exchanger in the system.
The values of friction loss (including entrance, exit loss- For a system made up of the suction side as shown in
es, pressure drop through heat exchangers, control valves Figure 3-41(a) and the discharge as shown in Figure 3-
and the like) are hSL and hDL. The total static head is D - 42(a), the total head is
SL, or [ (D + D’) - ( -SL)] if siphon action is ignored, and
[ (D + D’) - (S’L)] for worst case, good design practice.
Procedure:
where P, is used to designate a pressure different than PI.
1. Calculate the friction losses hsL and hDL for three or The static head is [ (D + PI) - (S + P2)], and the friction
more arbitrarily chosen flow rates, but rates which head is hDL + hSL.
span the area of interest of the system. Figure 3-52 illustrates the importance of examining the
2. Add [hSL + hDL + (D F S)] for each value of flow system as it is intended to operate, noting that there is a
calculated. These are the points for the system head wide variation in static head, and therefore there must be
curve. a variation in the friction of the system as the GPM deliv-
3. Plot the GPM values versus the points of step 2, above. ered to the tank changes. It is poor and perhaps erro-
4. The intersection of the system curve with the pump neous design to select a pump which will handle only the
impeller characteristic curve is the operating point average conditions, e.g., about 32 feet total head. Many
corresponding to the total head, H. This point will pumps might operate at a higher 7O-foot head when
change only if the external system changes. This may selected for a lower GPM value; however, the flow rate
be accomplished by adding resistance by partially clos- might be unacceptable to the process.