
Page 228 - APPLIED PROCESS DESIGN FOR CHEMICAL AND PETROCHEMICAL PLANTS, Volume 1, 3rd Edition
P. 228
200 Applied Process Design for Chemical and Petrochemical Plants
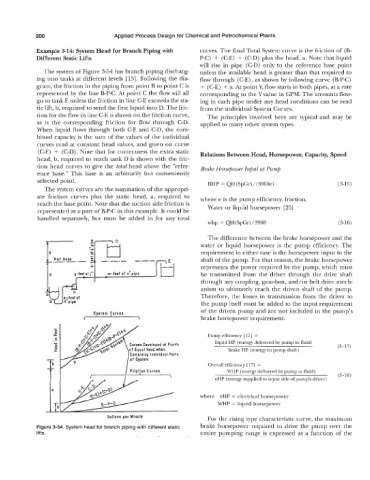
Example 3-14: System Head for Branch Piping with curves. The final Total System curve is the friction of (B-
Different Static Lifts P-C) + (C-E) + (C-D) plus the head, a. Note that liquid
will rise in pipe (C-D) only to the reference base point
The system of Figure 3-54 has branch piping discharg- unless the available head is greater than that required to
ing into tanks at different levels [13]. Following the dia- flow through (C-E), as shown by following curve (B-P-C)
gram, the friction in the piping from point B to point C is + (C-E) + a. At point Y, flow starts in both pipes, at a rate
represented by the line B-P-C. At point C the flow will all corresponding to the Y value in GPM. The amounts flow-
go to tank E unless the friction in line C-E exceeds the sta- ing in each pipe under any head conditions can be read
tic lift, b, required to send the first liquid into D. The fric- from the individual System Curves.
tion for the flow in line C-E is shown on the friction curve, The principles involved here are typical and may be
as is the corresponding friction for flow through C-D. applied to many other system types.
When liquid flows through both C-E and C-D, the com-
bined capacity is the sum of the values of the individual
curves read at constant head values, and given on curve
(C-E) + (C-D). Note that for correctness the extra static Relations Between Head, Horsepower, Capacity, Speed
head, b, required to reach tank D is shown with the fric-
tion head curves to give the total head above the "refer- Brake Horsepower Input at Pump
ence base." This base is an arbitrarily but conveniently
selected point. BHP = QH (SpGr) / (3960e) (3-15)
The system curves are the summation of the appropri-
ate friction curves plus the static head, a, required to where e is the pump efficiency, fraction.
reach the base point. Note that the suction side friction is Water or liquid horsepower [25}
represented as a part of B-P-C in this example. It could be
handled separately, but must be added in for any total
whp = QH(SpGr)/3960 (3-1 6)
The difference between the brake horsepower and the
water or liquid horsepower is the pump efficiency. The
requirement in either case is the horsepower input to the
shaft of the pump. For that reason, the brake horsepower
represents the power required by the pump, which must
4sr" through any coupling, gear-box, and/or belt drive mech-
be transmitted from the driver through the drive shaft
-
anism to ultimately reach the driven shaft of the pump.
Therefore, the losses in transmission from the driver to
e-feet
of
the pump itself must be added to the input requirement
of the driven pump and are not included in the pump's
System Curves
brake horsepower requirement.
Pump efficiency [17] =
liquid HP (energy delivered by pump to fluid)
(3-17)
brake HP (energy to pump shaft)
Combining Individual Parls
of System
r / Friction Curves Overall efficiency [17] =
WHP (energy delivered by pump to fluid)
(3-18)
eHP (energy supplied to input side of pump's driver)
where eHP = electrical horsepower
WHP = liquid horsepower
Gallons per Minule For the rising type characteristic curve, the maximum
Figure 3-54. System head for branch piping with different static brake horsepower required to drive the pump over the
lifts. entire pumping range is expressed as a function of the