
Page 172 - Applied Process Design For Chemical And Petrochemical Plants Volume II
P. 172
Distillation 161
where R, = ratio of top to bottom widths of trapezoid slot. The relation:
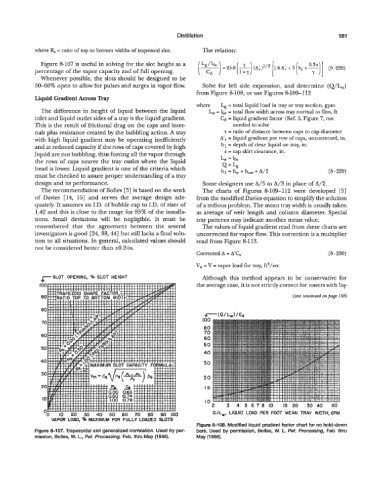
Figure 8-107 is useful in solving for the slot height as a
percentage of the vapor capacity and of full opening.
Whenever possible, the slots should be designed to be
50-60% open to allow for pulses and surges in vapor flow. Solve for left side expression, and determine (Q&,)
from Figure 8-108, or use Figures 8-109-112
Liquid Gradient Across Tray
where L, = total liquid load in tray or tray section, gpm
The difference in height of liquid between the liquid L, = lf~ total flow width across tray normal to flow, ft
=
inlet and liquid outlet sides of a tray is the liquid gradient. Cd = liquid gradient factor (Ref. 3, Figure 7, not
This is the result of frictional drag on the caps and inter- needed to solve
nals plus resistance created by the bubbling action. A tray y = ratio of distance between caps to cap diameter
with high liquid gradient may be operating inefficiently AIr = liquid gradient per row of caps, uncorrected, in.
and at reduced capacity if the rows of caps covered by high hl = depth of clear liquid on tray, in.
liquid are not bubbling, thus forcing all the vapor through s = cap skirt clearance, in.
the rows of caps nearer the tray outlet where the liquid L, = If,
Q=Lg
head is lower. Liquid gradient is one of the criteria which hi = h, + how + A/2 (8-229)
must be checked to assure proper understanding of a tray
design and its performance. Some designers use A/5 to A/3 in place of A/2.
The recommendation of Bolles [5] is based on the work The charts of Figures 8-109-112 were developed [5]
of Davies [14, 151 and serves the average design ade- from the modified Davies equation to simpllfy the solution
quately. It assumes an I.D. of bubble cap to I.D. of riser of of a tedious problem. The mean tray width is usually taken
1.42 and this is close to the range for 85% of the installa- as average of weir length and column diameter. Special
tions. Small deviations will be negligible. It must be tray patterns may indicate another mean value.
remembered that the agreement between the several The values of liquid gradient read from these charts are
investigators is good [24, 38,441 but still lacks a final solu- uncorrected for vapor flow. This correction is a multiplier
tion to all situations. In general, calculated values should read from Figure 8-113.
not be considered better than k0.2-in.
Corrected A = A'C, (8-230)
ITo = V = vapor load for tray, ft3/sec
rSLOT OPENING, Y SLOT HEIGHT Although this method appears to be conservative for
the average case, it is not strictly correct for towers with liq-
(text continued on pag 166)
100
80
70
60
50
49
30
20
15
"2 3 4 5 678 IO 15 20 30 40 60
v- Q/Lw, LIQUID LOAD PER FOOT MEAN TRAY WIDTH,GPM
0 IO 20 30 40 50 60 70 80 90 100
VAPOR LOAD, % MAXIMUM FOR FULLY LOADED SLOTS
Figure 8-108. Modlfied liquid gradient factor chart for no hold-down
Figure 8-107. Trapezoidal slot generalized correlation. Used by per- bars. Used by permission, Bolles, W. L. Pet, Processing, Feb. thru
mission, Bolles, W. L., Pet Processing, Feb. thru May (1 956). May (1 956).