
Page 173 - Applied Process Design For Chemical And Petrochemical Plants Volume II
P. 173
1 62 Applied Process Design for Chemical and Petrochemical Plants
L
0
w
a
a 2 3 4 5 6 7 8910 IS 20 30 40 50 60 70
-I
o e 3 4 5 6 7 8910 15 20 30 40 50 60 70
W
L
LIQUID LOAD PER FOOT MEAN TRAY WIDTH, GPM
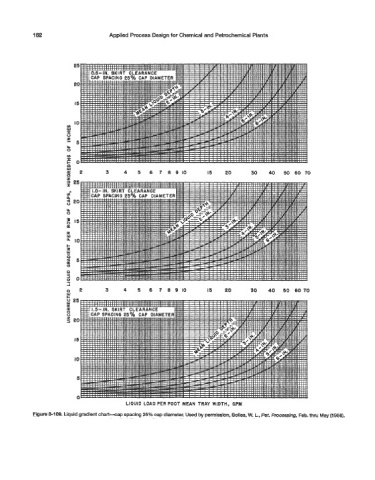
Figure 8-109. Liquid gradient chart-cap spacing 25% cap diameter. Used by permission, Bolles, W. L., Pet. Processing, Feb. thtu May (1956).