
Page 284 - Applied Process Design For Chemical And Petrochemical Plants Volume II
P. 284
Packed Towers 273
2. Deviations from optimal design of trays, packings and E = overall column efficiency, trdyed column, o/o
other tower internals, e.g., distributors and baffles. FP = flow parameter, dimensionless
3. Unique system characteristics and special design fea- HETP = height equivalent of a theoretical plate, in.
tures, e.g., corrosion, foaming, chemical reaction, L = liquid flow rate, lb/hr-fc2 of cross-sectional area
and fouling, and designs to overcome such problems. m = constant, allowing for vertical tower height con-
sumed by distribiition/redistribution equipment
4. Capacity and separation gains due to lower pressure S = tray spacing, in.
drop of packing. Pressure drop of packing is typically U = velocity, ft/sec based on tower superficial area
3 to 5 times lower than that of trays. or, UG = superficial velocity based on cross-section arca
of empty column, ft/sec
Due to the need to use case-by-case analysis the Kister V = vapor flow rate, Ib/hr-ft2 of cross-sectional area
studies [136, 1371 focused on item 1. The data evaluated p = density, Ib/ft3
came from published reports by Fractionation Research Fp = packing factor, empirical
(FRI) and Separation Research Program (SRP) at the Uni- Y = kinematic viscosity, liquid, centistokes (kinemat-
versity of Texas, taken from commercial size equipment ic viscosity = viscosity, centipoise/specific gravity
rather than laboratory research columns. The FRI data (not density))
includes No. 2 and No. 2.5 Nutter random rings packing, subscripts:
-d Norton’s Intalox@ 2T structured packing, each con-
sidered currently state-of-the-art or close to it, while the G = gas
sieve and valve trays were of FRI’s latest designs, plus Nut- L = liquid
ter’s proprietary valve trays, all using 24in. tray spacing.
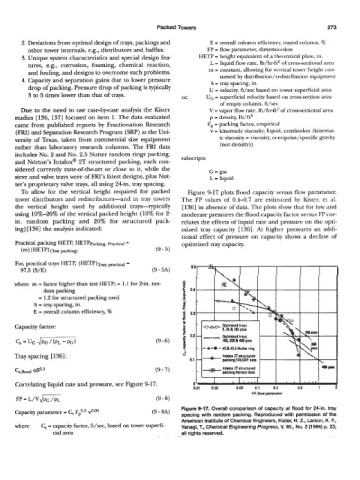
To allow for the vertical height required for packed Figure 9-17 plots flood capacity versus flow parameter.
tower distributors and redistributors-and in tray towers The FP values of 0.4-0.7 are estimated by Kister, et al.
the vertical height used by additional trays-typically [136] in absence of data. The plots show that for low and
using 10%-20% of the vertical packed height (10% for 2- moderate pressures the flood capacity factor versus FP cor-
in. random packing and 20% for structured pack- relates the effects of liquid rate and pressure on the opti-
ing) [ 1361 the analysis indicated: mized tray capacity [136]. At higher pressures an addi-
tional effect of pressure on capacity shows a decline of
Practical packing HETP, HETPpacking, practical = optimized tray capacity.
(m) (HETP) (Test packing) (9 - 5)
For, practical trays HETP, (HETP)T~~ practical = &
97.5 @/E) (9 - 5A) 0.51 I I I I I
where m = factor higher than test HETP; = 1.1 for 2-in. ran-
dom packing
= 1.2 for structured packing used
S = tray spacing, in.
E = overall column efficiency, %
Capacity factor:
Cs =Uc &GFZ (9 - 6)
Tray spacing [ 1361 : lntalox 27 muctured
0.1 PaCkh(l FRVSRP data
Cs,flood aS0.5 (9 - 7)
Correlating liquid rate and pressure, see Figure 9-17. om 0.02 0.05 0.1 02 0.5 1
FP, flow parameter
FP = L/Vdx (9 - 8)
Figure 9-17. Overall comparison of capacity at flood for 24-in. tray
Capacity parameter = C, Fpo.5 vo.O5 (9 - 8A) spacing with random packing. Reproduced with permission of the
American Institute of Chemical Engineers, Kister, H. Z., Larson, K. F.,
where C, = capacity factor, ft/sec, based on tower superfi- Yanagi, T., Chemical Engineering Pmgress, V. go., No. 2 (1 994) p. 23;
cial area all rights resewed.