
Page 293 - Applied Process Design For Chemical And Petrochemical Plants Volume II
P. 293
282 Applied Process Design for Chemical and Petrochemical Plants
with the recommendations of Table 9-24. Although there
is no validation, it is believed that the information in Table
9-25 is more current and represents a more recent evalua-
tion of available data. However, the fact that the results are
not identified by packing design types, suggests there
probably still needs to be more evaluation of this factor.
Note that when packing is changed from one material
of construction to another, it is important to recognize the
effect on minimum wetting rate for the new condition.
Loading Point-Loading Region
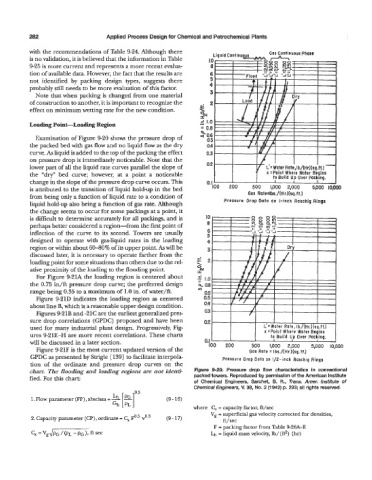
Examination of Figure 9-20 shows the pressure drop of
the packed bed with gas flow and no liquid flow as the dry
curve. As liquid is added to the top of the packing the effect
on pressure drop is immediately noticeable. Note that the
lower part of all the liquid rate curves parallel the slope of
the “dry” bed curve; however, at a point a noticeable
change in the slope of the pressure drop curve occurs. This 0.1 ’ I I I I 1 I
is attributed to the transition of liquid hold-up in the bed 100 200 500 1,000 2,000 5pOO ION0
Gas Rate=lbs./(Hr~(skft.)
from being only a function of liquid rate to a condition of Pressure Drop Data on I-inch Raschig Rings
liquid hold-up also being a function of gas rate. Although
the change seems to occur for some packings at a point, it
is dimcult to determine accurately for all packings, and is 10
perhaps better considered a region-from the first point of 8
inflection of the curve to its second. Towers are usually 6
5
designed to operate with gas-liquid rates in the loading 4
region or within about 6040% of its upper point. As will be 3
discussed later, it is necessary to operate farther from the
=
loading point for some situations than others due to the rel- \ 2
ative proximity of the loading to the flooding point. ON
I
For Figure 9-21A the loading region is centered about -7 1.0
i
the 0.75 in/ft pressure drop curve; the preferred design k0.8
range being 0.35 to a maximum of 1.0 in. of water/ft. 4 a6
Figure 9-21D indicates the loading region as centered 0.5
about line B, which is a reasonable upper design condition. 0.4
Figures 9-21B and -21C are the earliest generalized pres- 0.3
sure drop correlations (GPDC) proposed and have been a2
used for many industrial plant design. Progressively, Fig-
ures 9-21E-H are more recent correlations. These charts
will be discussed in a later section. 0. I 200 500 1,000 2,000 5,000 10,000
100
Figure 9-21F is the most current updated version of the Gas Rote = Ibs./(Hr.)(sq.ft)
GPDC as presented by Strigle [139] to facilitate interpola- Pressure Drop Data on 1/2-inch Raschig Rings
tion of the ordinate and pressure drop curves on the
chart. The flooding and loading regions are not identi- Figure 9-20. Pressure drop flow characteristics in conventional
fied. For this chart packed towers. Reproduced by permission of the American lnstiiute
of Chemical Engineers, Sarchet, B. R.. Trans. Amer. institute of
Chemical Engineers, V. 38, No. 2 (1942) p. 293; all rights reserved.
1. Flow parameter (FP), abscissa = (9 - 16)
where C, = capacity factor, ft/sec
Vg = superficial gas velocity corrected for densities,
2. Capacity parameter (CP), ordinate = C, F0.’ v0.5 (9 - 17) ft/sec
F = packing factor from Table 9-26A-E
Lh = liquid mass velocity, lb/(ft2) (hr)