Page 294 - Applied Process Design For Chemical And Petrochemical Plants Volume II
P. 294

Packed Towers                                           283


                                                                                             of  Curves  IS  Pressure
                                                                                            ches of  WaterlFoot
                                                                                            Approximate Flooding


                  0.01      0. I      I        IO                                                             3
                             UG m

                                                             L = LIQUID  RATE,  LBS /SEC,  SQ  FT   g = VISCOSITY  OF  LIQUID, CENTIPOISE.
                                                             G = GAS  RATE,  LBS /SEC , SO  FT   g, = GRAVATATIONAL  CONSTANT   32 2  FT /fSEC 8dSEC
      Figure 9-21A.  Sherwood-type  correlation for flooding gas rate at a   0,. =LIQUID  DENSITY.  LBS /CU  FT   G'  =GAS  RATE.  LBS /HR
                                                                                  L'  =LIQUID  RATE,  1% /HR
                                                             po = GAS  DENSITY,  LBS /CU  FT
      given liquid rate. Used by permission of Zenz, F. A., Chemical Engi-   F = PACKING  FAClOR   a /e'
      neering, Aug. (1 953), p. 181 ; all rights reserved.
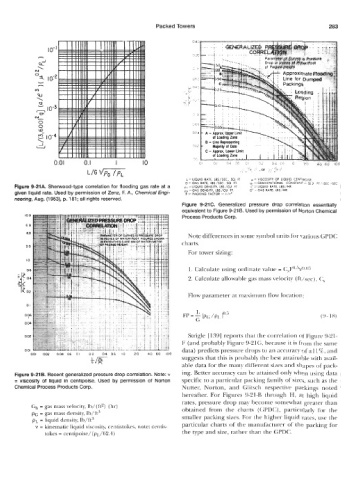
                                                            Figure  9-21 C.  Generalized  pressure  drop  correlation  essentially
                                                            equivalent to Figure 9-21  B. Used by permission of Norton Chemical
         10 0                                               Process Products Corp.
         60
          40
                                                              Note differences in some symbol units for various GPDC
                                                            charts.
          20
                                                              For tower sizing:
          10
          06                                                  1. Calculate using ordinate value = CsF0~3~0.05
                                                              2. Calculate allowdbk gas mass velocity (ft/sec), C,

        c 02
                                                              Flow parameter at maximum flow location:
          01
                                                                 L
                                                            FP = - [p<; /pL,                             (9- 18)
                                                                 G
         OW

         OM                                                   Strigle [ 1391 reports that the correlation of Figure 9-21-
                                                            F (and probably Figure 9-21C, because it is from the same
         0 01                                               data) predicts pressure drops to an accuracy of 21 1 %, and
           001   002   004  06  01   02   04  06   10   20   40  60  I00
                                                            suggests that this is probably the best attainable with avail-
                                                            able data for the many different sizes and shapes of pack-
                                                            ing. Better accuracy can be attained only when using data
      Figure 9-21 B. Recent generalized pressure drop correlation. Note: Y
      = viscosity  of  liquid  in  centipoise.  Used  by permission  of  Norton   specific to a particular packing family of sizes, such as the
      Chemical Process Products Corp.                       Nutter,  Norton,  and  Glitsch  respective  packings  noted
                                                            hereafter.  For  Figures 9-21-B through  H, at  high  liquid
                                                            rates, pressure drop may  become somewhat greater than
           Gh = gas mass velocity, Ib/(ft')  (hr)           obtained  from  the  charts  (GPDC), particularly  for  the
            p~ = gas mass density, lb/ft.'
            p~ = liquid density, Ib/ft.?                    smaller packing sizes. For the higher liquid rates, use the
             Y  = kinematic liquid viscosity, centistokes, note: centis-   particular charts of  the manufacturer  of  the packing for
                tokes = centipoise/  (p1./62.4)             the type and size, rather than the GPDC.
   289   290   291   292   293   294   295   296   297   298   299