
Page 295 - Applied Process Design For Chemical And Petrochemical Plants Volume II
P. 295
284 Applied Process Design for Chemical and Petrochemical Plants
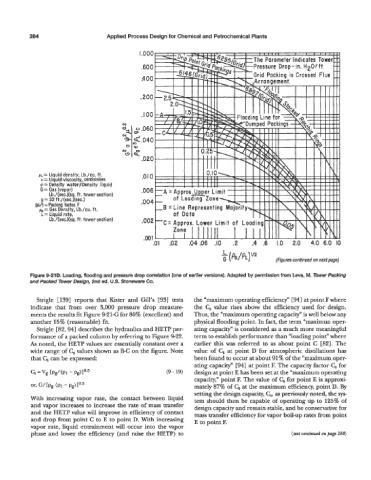
pL= liquid density, Lb./cu. ft.
Y = liquid viscosity, centistokes
q = Density water/Density liquid
G = Gas (vapor)
Lb./(sec.)(sq. ft. tower section)
g = 32 ft./(sec.)(sec.l
(ala = Packing factor, F
ps = Gas Density, Lb./cu. ft.
L = Liquid rate,
Lb./(sec.)(sq. ft. tower section)
(PG/PL)‘/’ (Figures continued on next page)
Figure 9-21 D. Loading, flooding and pressure drop cornlation (one of earlier versions). Adapted by permission from Leva, M. Tower Packing
and Packed Tower Design, 2nd ed. U.S. Stoneware Co.
Strigle [139] reports that Ester and Gill’s [93] tests the “maximum operating efficiency” [94] at point F where
indicate that from over 3,000 pressure drop measure- the C, value rises above the efficiency used for design.
ments the results fit Figure 9-214 for 80% (excellent) and Thus, the “maximum operating capacity” is well below any
another 15% (reasonable) fit. physical flooding point. In fact, the term “maximun oper-
Strigle [82,94] describes the hydraulics and HETP per- ating capacity” is considered as a much more meaningful
formance of a packed column by referring to Figure 9-22. term to establish performance than “loading point” where
As noted, the HETP values are essentially constant over a earlier this was referred to as about point C [82]. The
wide range of C, values shown as I3-C on the figure. Note value of C, at point D for atmospheric distillations has
that C, can be expressed: been found to occur at about 91 % of the “maximum oper-
ating capacity” E941 at point F. The capacity factor C, for
G =vg [Pg/(Pl - pg110-5 (9 - 19) design at point E has been set at the “maximum operating
capacity,” point F. The value of C, for point E is approxi-
or> WPg (P1 - Pg)P mately 87% of C, at the maximum efficiency, point D. By
setting the design capacity, C,, as previously noted, the sys-
With increasing vapor rate, the contact between liquid tem should then be capable of operating up to 125% of
and vapor increases to increase the rate of mass transfer design capacity and remain stable, and be conservative for
and the HETP value will improve in efficiency of contact mass transfer efficiency for vapor boil-up rates from point
and drop from point C to E to point D. With increasing E to point F.
vapor rate, liquid entrainment will occur into the vapor
phase and lower the efficiency (and raise the HEW) to (ted contind on pap 288)