
Page 299 - Applied Process Design For Chemical And Petrochemical Plants Volume II
P. 299
288 Applied Process Design for Chemical and Petrochemical Plants
more sensitive this condition becomes as the extreme right
hand side of the graph is approached.
a Kister’s [93] study indicates that flooding with the cur-
Li rent newerdesigned packings occurs just below 2 in.
I water/ft of packing, somewhat below the prediction given
t by the earlier Eckert chart, Figure 921C or D. The data
Design max. oper.’ D, plotted by Kister indicate that for larger packings (2 in. and
oapacily = 8O%F Min. HEW
3 in., for example) the flooding point is noted at much
lower pressure drops than suggested by Figure 9-21C. The
c,=v[ Pr PG 1 pressure drop at flood point has been found to be inde-
On5
pG
pendent of the Flow Parameter on the charts, but does vary
with the packing family and packing types [93,95].
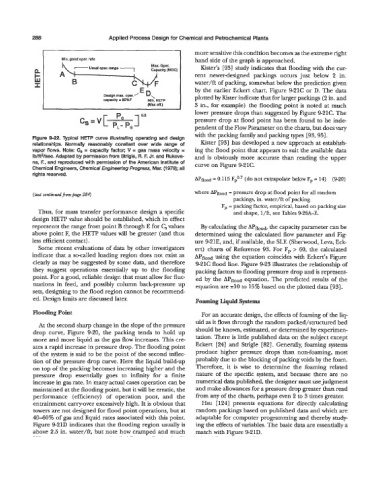
Figure 9-22. Typical HETP curve illustrating operating and design
relationships. Nomally reasonably constant over wide range of Kister [93] has developed a new approach at establish-
vapor flows. Note: C, = capacity factor; V = gas mass velocity = ing the flood point that appears to suit the available data
Ib/ftz/sec. Adapted by permission from Strigle, R. E Jr. and Rukove- and is obviously more accurate than reading the upper
na, F., and reproduced with permission of the American Institute of curve on Figure 9-21C.
Chemical Engineers, Chemical Engineering Progress, Mar. (1 979); all
rights resewed.
APflood - 0.115 Fp0.7 (do not extrapolate below Fp = 14) (920)
where APflood = pressure drop at flood point for all random
(text continucdbm page 284)
packings, in. water/ft of packing
Fp = packing factor, empirical, based on packing size
Thus, for mass transfer performance design a specific and shape, l/ft, see Tables 9-26A-E.
design HETP value should be established, which in effect
represents the range from point B through E for C, values By calculating the @flood, the capacity parameter can be
above point F, the HETP values will be greater (and thus determined using the calculated flow parameter and Fig-
less efficient contact). ure 9-21E, and, if available, the SIX (Shenvood, Leva, Eck-
Some recent evaluations of data by other investigators ert) charts of Reference 93. For Fp > 60, the calculated
indicate that a so-called loading region does not exist as APflood using the equation coincides with Eckert’s Figure
clearly as may be suggested by some data, and therefore 9-21C flood line. Figure 9-23 illustrates the relationship of
they suggest operations essentially up to the flooding packing factors to flooding pressure drop and is represent-
point. For a good, reliable design that must allow for fluc- ed by the APflood equation. The predicted results of the
tuations in feed, and possibly column back-pressure up equation are k10 to 15% based on the plotted data [93].
sets, designing to the flood region cannot be recommend-
ed. Design limits are discussed later. Foaming liquid Systems
Flooding Point For an accurate design, the effects of foaming of the Iiq-
uid as it flows through the random packed/structured bed
At the second sharp change in the slope of the pressure
drop curve, Figure 9-20, the packing tends to hold up should be known, estimated, or determined by experimen-
more and more liquid as the gas flow increases. This cre- tation. There is little published data on the subject except
ates a rapid increase in pressure drop. The flooding point Eckert [24] and Strigle [82]. Generally, foaming systems
of the system is said to be the point of the second inflec- produce higher pressure. drops than non-foaming, most
tion of the pressure drop curve. Here the liquid build-up probably due to the blocking of packing voids by the foam.
on top of the packing becomes increasing higher and the Therefore, it is wise to determine the foaming related
pressure drop essentially goes to infinity for a finite nature of the specific system, and because there are no
increase in gas rate. In many actual cases operation can be numerical data published, the designer must use judgment
maintained at the flooding point, but it will be erratic, the and make allowances for a pressure drop greater than read
performance (efficiency) of operation poor, and the from any of the charts, perhaps even 2 to 3 times greater.
entrainment carry-over excessively high. It is obvious that Hsu [ 1241 presents equations for directly calculating
towers are not designed for flood point operations, but at random packings based on published data and which are
-0% of gas and liquid rates associated with this point. adaptable for computer programming and thereby study-
Figure 9-21D indicates that the flooding region usually is ing the effects of variables. The basic data are essentially a
above 2.5 in. water/ft, but note how cramped and much match with Figure 9-21D.