
Page 303 - Applied Process Design For Chemical And Petrochemical Plants Volume II
P. 303
292 Applied Process Design for Chemical and Petrochemical Plants
necessarily all) packing factors are presented in Table 9-
26A. These values are to be used with the application of Fig- I I I--'
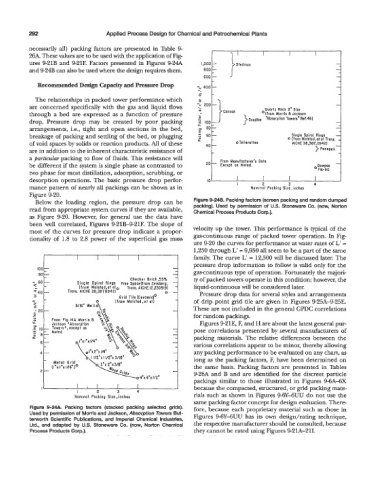
ures 9-21B and 9-21F. Factors presented in Figures 9-24.4 1,000 - Sfedman -
and 9-24B can also be used where the design requires them. 800 -
-
600 -
-
Recommended Design Capacity and Pressure Drop 400 - -
-
\ -
0
The relationships in packed tower performance which
are concerned specifically with the gas and liquid flows oQuartz Rock 2" Size -
through a bed are expressed as a function of pressure Cannon \from Morris B Jackson
Absorption
drop. Pressure drop may be created by poor packing G ~ ~ , J ~ ~ ~Towers' Ref.46) -
-
arrangements, i.e., tight and open sections in the bed, .- -
-
-
Single Spiral Rings
breakage of packing and settling of the bed, or plugging 2 60- 0 (from Malstad,et a1 Trans. -
of void spaces by solids or reaction products. All of these n 40 - oTellerettes AlCHE 38,387,119421
are in addition to the inherent characteristic resistance of - > Panapak- -
a particular packing to flow of fluids. This resistance will From Manufacturer's Data
be different if the system is single phase as contrasted to Except as Noted. oDowpac -
two phase for most distillation, adsorption, scrubbing, or FN-90
desorption operations. The basic pressure drop perfor- IO I 1 I I
mance pattern of nearly all packings can be shown as in I 2 3 4
Figure 9-20.
Below the loading region, the pressure drop can be Figure 9-24B. Packing factors (screen packing and random dumped
read from appropriate system curves if they are available, packing). Used by permission of US. Stoneware Co. (now, Norton
Chemical Process Products Corp.).
as Figure 9-20. However, for general use the data have
been well correlated, Figures 9-21B-9-21F. The slope of
most of the curves for pressure drop indicate a propor- velocity up the tower. This performance is typical of the
tionality of 1.8 to 2.8 power of the superficial gas mass gas-continuous range of packed tower operation. In Fig-
ure 9-20 the curves for performance at water rates of L' =
1,250 through L' = 9,950 all seem to be a part of the same
I I I I family. The curve L' = 12,500 will be discussed later. The
- pressure drop information to follow is valid only for the
IO0 -
80 - gascontinuous type of operation. Fortunately the majori-
-
- 60- ty of packed towers operate in this condition; however, the
< - - liquid-continuous will be considered later.
:40-
. Pressure drop data for several styles and arrangements
0
n U - of drip point grid tile are given in Figures 9-25A-9-25E.
w
- These are not included in the general GPDC correlations
&- 20-
-
for random packings.
"
0
z Figures 9-21E, F, and H are about the latest general pur-
.!E = 10- - pose correlations presented by several manufacturers of
:: 8-
n.- packing materials. The relative differences between the
6-
- various correlations appear to be minor, thereby allowing
4- any packing performance to be evaluated on any chart, as
- long as the packing factors, F, have been determined on
the same basis. Packing factors are presented in Tables
2-
9-26A and B and are identified for the discreet particle
packings similar to those illustrated in Figures 9-6A-6X
I I l l I I 1 because the compacted, structured, or grid packing mate-
I 2 3 4
Nominal Packing Size, inches rials such as shown in Figures 9-6Y-6UU do not use the
same packing factor concept for design evaluation. There-
Figure 9-24A. Packing factors (stacked packing selected grids). fore, because each proprietary material such as those in
Used by permission of Morris and Jackson, Absorption Towers But- Figures 9-6Y-6UU has its own design/rating technique,
terworth Scientific Publications, and Imperial Chemical Industries,
Ltd., and adapted by U.S. Stoneware Co. (now, Norton Chemical the respective manufacturer should be consulted, because
Process Products Corp.). they cannot be rated using Figures 9-21A-211.