
Page 310 - Applied Process Design For Chemical And Petrochemical Plants Volume II
P. 310
Packed Towers
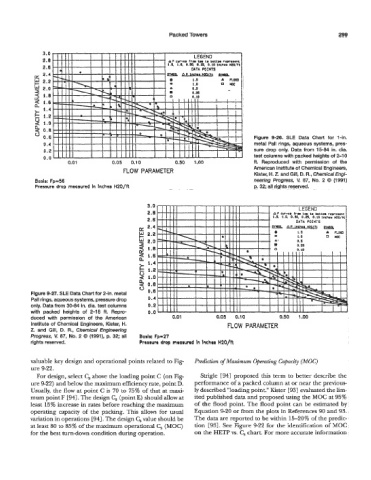
Figute 9-26. SLE Data Chart for 1-in.
metal Pall rings, aqueous systems, pres-
sure drop only. Data from 15-84 in. dia.
test columns with packed heights of 2-1 0
ft. Reproduced with permission of the
FLOW PARAMETER American Institute of Chemical Engineers,
Kister, H. 2. and Gill, D. R., Chemical Engi-
Basis: Fp-56 neering Progress, V. 87, No. 2 0 (1991)
Pressure drop measured in Inthas HZO/ft p. 32; all rights reserved.
Figure 9-27. SLE Data Chart for 2-in. metal
Pall rings, aqueous systems, pressure drop
only. Data from 30-84 in. dia. test columns
with packed heights of 2-18 ft. Repro-
duced with permission of the American
Institute of Chemical Engineers, Kister, H.
2. and Gill, D. R., Chemical Engineering
Progress, V. 87, No. 2 0 (1991), p. 32; all Basis: Fp47
rights reserved. Prwurr drop mroaund In Inrhra H20/ft
valuable key design and operational points related to Fig- Prediction of Maximum Operating Capacity (MOC)
ure 9-22.
For design, select C, above the loading point C (on Fig- Su-igle [94] proposed this term to better describe the
ure 9-22) and below the maximum efficiency rate, point D. performance of a packed column at or near the previous-
Usually, the flow at point C is 70 to 75% of that at maxi- ly described “loading point.” Kister [93] evaluated the lim-
mum point F [94]. The design C, (point E) should allow at ited published data and proposed using the MOC at 95%
least 15% increase in rates before reaching the maximum of the flood point. The flood point can be estimated by
operating capacity of the packing. This allows for usual Equation 9-20 or from the plots in References 90 and 93.
variation in operations [94]. The design C, value should be The data are reported to be within 15-20% of the predic-
at least 80 to 85% of the maximum operational C, (MOC) tion [93]. See Figure 9-22 for the identification of MOC
for the best turn-down condition during operation. on the HETP vs. C, chart. For more accurate information