
Page 314 - Applied Process Design For Chemical And Petrochemical Plants Volume II
P. 314
Packed Towers 303
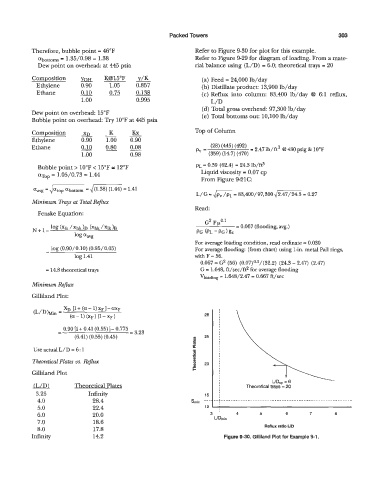
Therefore, bubble point = 46°F Refer to Figure 9-30 for plot for this example.
abottoms = 1.35/0.98 = 1.38 Refer to Figure 9-29 for diagram of loading. From a mate-
Dew point on overhead: at 443 psia rial balance using (L/D) = 6.0; theoretical trays = 20
Composition K@lj0F y/K (a) Feed = 24,000 lb/day
Ethylene 0.90 1.05 0.85'7 (b) Distillate product: 13,900 lb/day
Ethane 0.10 0.7j 0.138 (c) Reflux into column: 83,400 lb/day @ 6:l reflux,
1 .oo 0.995 L/D
(d) Total gross overhead: 97,300 lb/day
Dew point on overhead: 15°F (e) Total bottoms out: 10,100 lb/day
Bubble point on overhead: Try 10°F at 445 psia
Composition a - K - Top of Column
Kx
Ethylene 0.90 1.00 0.90
Ethane - 0.80 0.08 (28) (445) (492) = 2.47 lb/ft3 @ 430 psig & 10°F
0.10
1 .oo 0.98 "' = (359) (14.7) (470)
Bubble point > 10°F < 15°F E 12°F PL = 0.39 (62.4) = 24.3 lb/ft3
= 1.05/0.73 = 1.44 Liquid viscosity = 0.07 cp
From Figure 421C:
I
aavg = ;atop abottom = J(1.38) (1.44) = 1.41
L/G = dx 83,400/97,300\/2.47/24.3 = 0.2'7
=
Minimum Trays at Total Reflux
Read:
Fenske Equation:
G2 FpO.l
N+1= log (xlk /Xhk )D (xhk ixlk )B PG (PL - PG gc = 0.067 (flooding, avg.)
1% Qavg
For average loading condition, read ordinate = 0.030
- log (0.90/0.10) (0.95/0.05) For average flooding: (from chart) using 1-in. metal Pall rings,
-
log 1.41 with F = 56.
0.067 = G2 (56) (0.07)'.'/(32.2) (24.3 - 2.47) (2.47)
= 14.8 theoretical trays G = 1.648, ft/sec/ft2 for average flooding
Vloading = 1.648/2.47 = 0.667 ft/.SeC
Minimum Rejlux
Gilliland Plot:
- - 0.90 [1+ 0.41 (0.55)] - 0.775 = 3.23
(6.41) (0.55) (0.45)
Use actual L/D = 6 : 1
Theoretical Plates us. Reflux
Gilliland Plot
m Theoretical Plates Theoretical trays = 20
3.23 Infinity
4.0 28.4
5.0 22.4
6.0 20.0
7.0 18.6
8.0 17.8
Infinity 14.2 Figure 9-30. Gilliland Plot for Example 9-1.