
Page 318 - Applied Process Design For Chemical And Petrochemical Plants Volume II
P. 318
Packed Towers 307
Table 9-32 10 I I I
Nutter Ring Hydraulic Coefficients
... . ...... .... .... ,
Nutter Ring(TM)
Size c1 X1 x2 x3 x,
--
0.7 0.141 0.735 -0.00646 1.0 0.05
1 0.095 0.870 -0.00562 1.10 0.08
1.5 0.070 0.969 -0.00230 1.12 0.08
2 0.059 1.000 0.0 1.15 0.08
2.5 0.051 1.0394 0.000653 1.15 0.08
3 0.037 1.124 0.002076 1.15 0.10
. . ..... .... -.
Used by permission of Nutter Engineering, a Harsco Corp.
where C1 = coefficient from Table 9-32.
Operating pressure drop:
where C3 = max. value of [(ZQI) (X,)], or [X, itsew (9-50)
Cs = wet pressure drop slope coefficient
zQ1 = 0.1084 - 0.00350 Q1 + 0.0000438 Q2 + 7.67 X
lo-’ Q3 - 1.4 x lo-* Q14 (9-51)
zQ1 = liquid rate factor for C3, in. water/ft 0 0.4
X3,X4 = constants from Table 9-32. Vapor Rate, CS, ft/s
APd = dry bed pressure drop, in. water/ft x: Air-lsopar +: C6 - C7
5, 15, 24 psia
AP = operating pressure drop, in. liquid/ft
e = base of natural logarithms
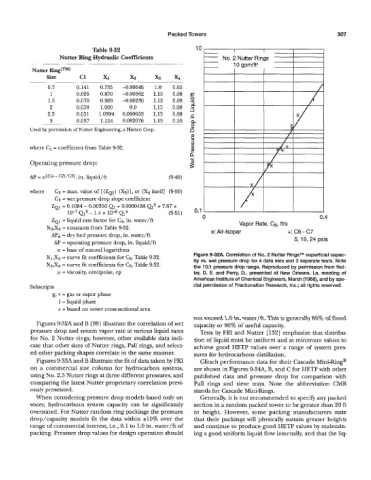
X1,Xz = curve fit coefficients for C2, Table 9-32. Figure 9-32A. Correlation of No. 2 Nutter RingsTM superficial capac-
X3,& = curve fit coefficients for C3, Table 9-32. ity vs. wet pressure drop for 4 data sets and 3 separate tests. Note
the 1O:l pressure drop range. Reproduced by permission from Nut-
y = viscosity, centipoise, cp ter, D. E. and Perry, D., presented at New Orleans, La. meeting of
American Institute of Chemical Engineers, March (1 988), and by spe-
Subscripts cial permission of Fractionation Research, Inc.; all rights reserved.
g, v = gas or vapor phase
1 = liquid phase
s = based on tower cross-sectional area
not exceed 1.0 in. water/ft. This is generally 80% of flood
Figures 932A and B [98] illustrate the correlation of wet capacity or 90% of useful capacity.
pressure drop and system vapor rate at various liquid rates Tests by FRI and Nutter [132] emphasize that distribu-
for No. 2 Nutter rings; however, other available data indi- tion of liquid must be uniform and at minimum values to
cate that other sizes of Nutter rings, Pall rings, and select- achieve good HETP values over a range of system pres-
ed other packing shapes correlate in the same manner. sures for hydrocarbons distillation.
Figures 9-33A and B illustrate the fit of data taken by FRI Glitsch performance data for their Cascade Mini-Ring8
on a commercial size column for hydrocarbon systems, are shown in Figures 9-34A, B, and C for HETP with other
using No. 2.5 Nutter rings at three different pressures, and published data and pressure drop for comparison with
comparing the latest Nutter proprietary correlation previ- Pall rings and sieve trays. Note the abbreviation CMR
ously presented. stands for Cascade Mini-Rings.
When considering pressure drop models based only on Generally, it is not recommended to specify any packed
water, hydrocarbons system capacity can be significantly section in a random packed tower to be greater than 20 ft
overstated. For hhtter random ring packings the pressure in height. However, some packing manufacturers state
drop/capacity models fit the data within 210% over the that their packings will physically sustain greater heights
range of commercial interest, i.e., 0.1 to 1.0 in. water/ft of and continue to produce good HETP values by maintain-
packing. Pressure drop values for design operation should ing a good uniform liquid flow internally, and that the liq-