
Page 321 - Applied Process Design For Chemical And Petrochemical Plants Volume II
P. 321
31 0 Applied Process Design for Chemical and Petrochemical Plants
able to accommodate both changing process require
ments and errors or lack of agreement between calcula-
tions and actual operations performance.
Dumped Packing: Gas-Liquid System Below Loading
Figures 9-21B-H can be used effectively to determine
the performance for new designs or for existing operating
columns.
Dumped Packing: Loading and Flooding Regions,
General Design Correlations
Figure 9-21B, -21F, or -21H may be used for any system to
obtain a good estimate of pressure drop for practically any
random packing material. The relative state of liquid posi-
tion of the point on the graph, and the approximate pres
I I I I I
0.15 0.20 0.25 0.30 0.35 sure drops per foot of packing depth may be read as para-
C-factor meters. It is important to recognize that the load upper
limit, line A, is essentially coincident with the flooding con-
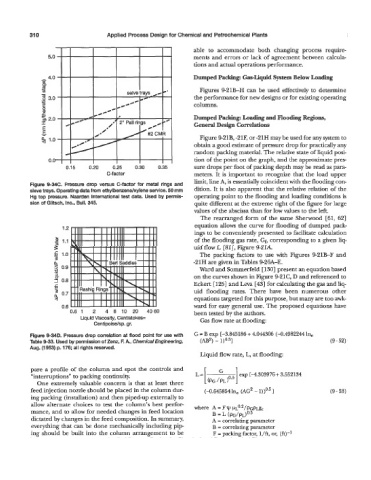
Figure 9-34C. Pressure drop versus C-factor for metal rings and
sieve trays. Operating data from ethylbenzendxylene service. 50 mm dition. It is also apparent that the relative relation of the
Hg top pressure. Naarden International test data. Used by permis- operating point to the flooding and loading conditions is
sion of Glitsch, Inc., Bull. 345. quite different at the extreme right of the figure for large
values of the abscissa than for low values to the left.
The rearranged form of the same Sherwood [61, 621
equation allows the curve for flooding of dumped pack-
1.2
ings to be conveniently presented to facilitate calculation
L
$ 1.1 of the flooding gas rate, Gf, corresponding to a given liq-
3 uid flow L [81], Figure 9-21A.
g 1.0 The packing factors to use with Figures 9-21B-F and
a -21H are given in Tables 9-26A-E.
.- 0.9 Ward and Sommerfeld [ 1301 present an equation based
=I on the curves shown in Figure 9-21C, D and referenced to
U
7 0.8 Eckert [ 1251 and Leva [43] for calculating the gas and liq-
5
‘5 0.7 uid flooding rates. There have been numerous other
4 equations targeted for this purpose, but many are too awk-
0.6 ward for easy general use. The proposed equations have
0.6 1 2 4 6 10 20 4C 1 60 been tested by the authors.
Liquid Viscosity, Centistokes= Gas flow rate at flooding:
Centipoisekp. gr.
Figure 9-34D. Pressure drop comlation at flood point for use with G = B exp [-3.845186 + 4.044306 (-0.4982244 In,
-
-
Table 9-33. Used by permission of Zenz, F. A., Chemical Engineering, (m2) 1)0.5] (9 52)
Aug. (1 953) p. 176; all rights reserved.
Liquid flow rate, L, at flooding:
pare a profile of the column and spot the controls and
“interruptions” to packing continuity. exp [-4.303976 + 3.552134
One extremely valuable concern is that at least three [ (PG /PI. )O”]
-
feed injection nozzle should be placed in the column dur- (-0.645854 In, (AG2 - l))0.5 (9 53)
]
ing packing (installation) and then piped-up externally to
allow alternate choices to test the column’s best perfor- where A = F W pLo.2/pcpLgc
mance, and to allow for needed changes in feed location
dictated by changes in the feed composition. In summary, B = L (PG/PL)0’5
A = correlating parameter
everything that can be done mechanically including pip- B = correlating parameter
ing should be built into the column arrangement to be F = packing factor, l/ft, or, (ft)-1