
Page 319 - Applied Process Design For Chemical And Petrochemical Plants Volume II
P. 319
308 Applied Process Design for Chemical and Petrochemical Plants
I I I
0.1 I I I I
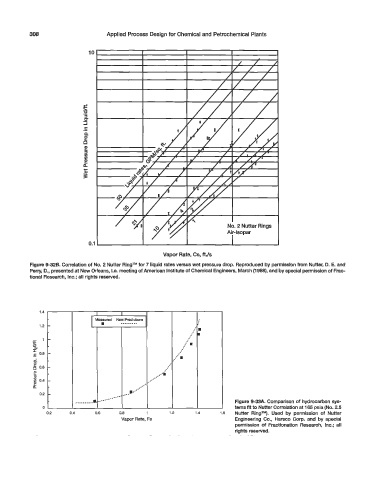
Vapor Rate, Cs, ft./s
Figure 9-326. Correlation of No. 2 Nutter RingTM for 7 liquid rates versus wet pressure drop. Reproduced by permission from Nutter, D. E. and
Perry, D., presented at New Orleans, La. meeting of American Institute of Chemical Engineers, March (1988), and by special permission of Frac-
tional Research, Inc.; all rights reserved.
1.4
1.2
e 1
9
.- 0.6
d
0.6
e!
3
3 0.4
e!
a
0.2 .---
,*...--- Figure 9-33A. Comparison of hydrocarbon sys-
0 tems fit to Nutter Correlation at 165 psia (No. 2.5
0.2 0.4 0.6 0.6 1 1.2 1.4 1.6 Nutter RingT?. Used by permission of Nutter
Vapor Rate, Fs Engineering Co., Harsco Corp. and by special
permission of Fractionation Research, Inc.; all
rights reserved.