
Page 322 - Applied Process Design For Chemical And Petrochemical Plants Volume II
P. 322
Packed Towers 31 1
G = gas flow rate, lb/(hr) (ft2) continuous and the gas phase discontinuous. This is obvi-
gc = Newton's Law, proportionality factor ously at relatively high liquor rates, but not beyond the
= (4.17 x lo8), (ft-lb,) (lbFhr2) range of satisfactory performance for the equipment. This
L = liquid flow rate, lb/(hr-ft2) region is characterized by proportionally higher pressure
X = abscissa in the generalized pressure drop correlation, drops than the gas-continuous region, and the existence of
= (L/G) (PG/PL)O.' a critical liquid rate as this pressure drop deviation occurs.
Y = ordinate in the generalized pressure drop correlation, Referring to Figure 9-20 the curve for L'-12,500 shows
G2F '$pLo'2/pGpLgc
p = viscosity, centipoise the beginning of the "move to the left," swinging away from
p = density, lb/ft3 the uniform slope of the curves for lower L' values.
'$ = ratio of water density to liquid density This probably is not the L, value for the system. The
study of Zenz suggests that the critical liquid rate, L,, is the
Subscripts minimum liquid rate that compbteij wets the packing thus
having essentially all packing surface effective for gas con-
G = gas phase tact. Rates above this value should be determined by allow-
L = liquid phase
able pressure drop and the limitation that the tower often
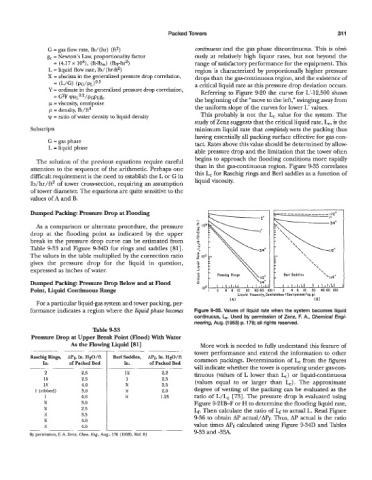
The solution of the previous equations require careful begins to approach the flooding conditions more rapidly
attention to the sequence of the arithmetic. Perhaps one than in the gas-continuous region. Figure 9-35 correlates
difficult requirement is the need to establish the L or G in this L, for Raschig rings and Berl saddles as a function of
lb/hr/ft2 of tower cross-section, requiring an assumption liquid viscosity.
of tower diameter. The equations are quite sensitive to the
values of A and B.
Dumped Packing: Pressure Drop at Flooding I
As a comparison or alternate procedure, the pressure
drop at the flooding point as indicated by the upper
break in the pressure drop curve can be estimated from
Table 9-33 and Figure 9-34D for rings and saddles [81].
The values in the table multiplied by the correction ratio
gives the pressure drop for the liquid in question,
expressed as inches of water.
._ Raschig Rings I
0
v
Dumped Packing: Pressure Drop Below and at Flood 0 I ,11,1,, I 11,1,1,,
Point, Liquid Continuous Range lo' I 2 4 6 10 20 40 60 00 I 2 4 6 10 20 40 60 100
..
Liauid Vircoiitv.Cenfirloker =Cenliooiseslrp.ar.
IAI
For a particular liquid-gas system and tower packing, per-
formance indicates a region where the liquid phase becoms Figure 9-35. Values of liquid rate when the system becomes liquid
continuous, L. Used by permission of Zenz, F. A., Chemical Engi-
neering, Aug. (1953) p. 176; all rights reserved.
Table 9-33
Pressure Drop at Upper Break Point (Flood) With Water
As the Flowing Liquid [81] More work is needed to fully understand this feature of
. .. . . __ .. tower performance and extend the information to other
APf, In. HtO/ft common packings. Determination of L, from the figures
In. of Packed Bed In. of Packed Bed
.. .. ~ will indicate whether the tower is operating under gas-con-
2 2.2 tinuous (values of L lower than L,) or liquidcontinuous
1% 1 2.5 (values equal to or larger than L,). The approximate
1% w 2.5
1 (ribbed) !4 2.0 degree of wetting of the packing can be evaluated as the
1 4.0 1.25 ratio of L/L, [73]. The pressure drop is evaluated using
% 3.0 Figure 9-21B-F or H to determine the flooding liquid rate,
(I 2.5 Lf. Then calculate the ratio of Lf to actual L. Read Figure
n 3.5
x 4.0 9-36 to obtain AP actual/APf. Thus, AP actual is the ratio
!4 4.0 value times APf calculated using Figure 9-34D and Tables
__ .. 9-33 and -33A.
By permission, F. A. Zenz, Chem. Eng., Aug., 176 (1953), Ref. 81