
Page 62 - Applied Process Design For Chemical And Petrochemical Plants Volume II
P. 62
Distillation 51
Solve for the value of 8 by graphically or otherwise plotting P = 100 (~/DD), ’31
1 / [ 1 - (L/17) 1 (XD - XU.) The values of overhead composition can be varied from
x3 of Figure 8-33 to other values as the drawoff percentage
versus xw and determining the area under the curve changes. As the drawoff percentage decreases, the distil-
between xw0 and XW. Then substitute this value for the late specification can be better maintained as the distilla-
integral in the Equation 8-100 and solve for 8. tion operation continues for a fixed number of plates. For
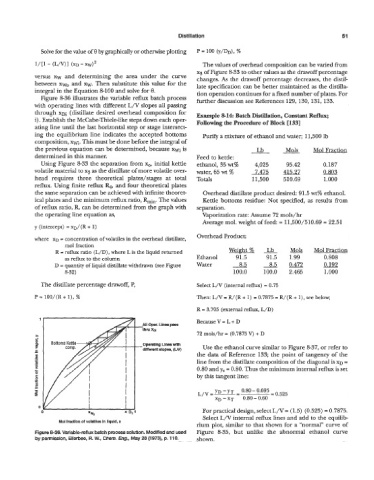
Figure 8-36 illustrates the variable reflux batch process further discussion see References 129, 130, 131,133.
with operating lines with different L/V slopes all passing
through xni (distillate desired overhead composition for Example 8-14 Batch Distillation, Constant Reflux;
i) . Establish the McCabe-Thiele-like steps down each oper- Following the Procedure of Block [133]
ating line until the last horizontal step or stage intersect-
ing the equilibrium line indicates the accepted bottoms Purify a mixture of ethanol and water; 11,500 lb
composition, xwi. This must be done before the integral of
the previous equation can be determined, because xwi is Lb Mols Mol Fraction
determined in this manner. Feed to kettle:
Using Figure 8-33 the separation from xo, initial kettle ethanol, 35 wt% 4,025 95.42 0.187
volatile material to x3 as the distillate of more volatile over- water, 65 wt % 7.475 415.27 0.803
head requires three theoretical plates/stages at total Totals 11,500 510.69 1.000
reflux. Using finite reflux Q, and four theoretical plates
the same separation can be achieved with infinite theoret- Overhead distillate product desired: 91.5 wt% ethanol.
ical plates and the minimum reflux ratio, Rin. The values Kettle bottoms residue: Not specified, as results from
of reflux ratio, R, can be determined from the graph with separation.
the operating line equation as, Vaporization rate: Assume 72 mols/hr
Average mol. weight of feed: = 11,500/510.69 = 22.51
y (intercept) = XD/(R + 1)
Overhead Product:
where XD = concentration of volatiles in the overhead distillate,
mol fraction
R = reflux ratio (L/D), where L is the liquid returned Weiht % & Mols MolFraction
as reflux to the column Ethanol 91.5 91.5 1.99 0.808
D = quantity of liquid distillate withdrawn (see Figure Water 8.5 8.50.472 QJ$g
8-32) 100.0 100.0 2.465 1.000
The distililate percentage drawoff, P, Select L/V (internal reflux) = 0.75
P = 100/(R + l), 9% Then: L/V = R/(R + 1) = 0.7875 = R/(R + l), see below;
R = 3.705 (external reflux, L/D)
Because V = L + D
I Opar. Lines pass
N Xa
72 mols/hr = (0.7875 V) + D
Operating Lines with Use the ethanol curve similar to Figure 8-37, or refer to
different slopes, (UV)
the data of Reference 133; the point of tangency of the
line from the distillate composition of the diagonal is XD =
0.80 and yv = 0.80. Thus the minimum internal reflux is set
by this tangent line:
YD - YT - 0.80 - 0.695
L/V=-- = 0.525
XD - XT 0.80 - 0.60
0 X Dil For practical design, select L/V= (1.5) (0.525) = 0.7875.
xwo Select L/V internal reflux lines and add to the equilib-
Mol fraction of volatiles in liquid, x
rium plot, similar to that shown for a “normal” curve of
Figure 8-36. Variable-reflux batch process solution. Modified and used Figure 8-35, but unlike the abnormal ethanol curve
by permission, Ellerbee, R. W., Chem. Eng., May 28 (1 973), p. 11 0. shown.