Page 63 - Applied Process Design For Chemical And Petrochemical Plants Volume II
P. 63

Applied Process Design for Chemical and Petrochemical Plants
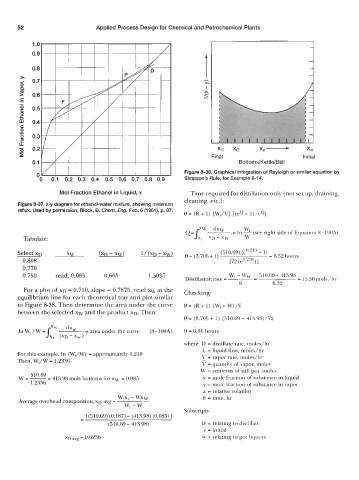


                                                                                     xx -


                                                                        Xi1   Xi2                    XI0
                                                                      Final                        Initial
                                                                               Bottoms/Kettle/Still
                                                             Figure 8-38. Graphical integration of Rayleigh or similar equation by
                                                             Simpson's Rule, for Example 8-14.
                    Mol Fraction Ethanol in Liquid, x          Time required for distillation only (not set up, draining,
                                                             cleaning, etc.):
       Figure 8-37. x-y diagram for ethanol-water mixture, showing minimum
       reflux. Used by permission, Block, B. Chern. Eng. Feb. 6 (1961), p. 87.
                                                             0 = (R+ 1) [Wi/V]  [(eQ- l)/eQ]

                                                                                Wi
                                                             Q=Jxw    dxw  , = In - (see right side of  Equation 8 - 100A)
         Tabulate:                                               xi   XD-XW     w

       Select XD       xw        (XD - XW)     1/ (XD - xw)
        0.808
        0.770
        0.750      read, 0.085     0.665         1.5037                    Wi  - Ww   510.69 - 413.98
                                                                                   -
                                                             Distillation rate =   -              = 15.30 mols/hr
                                                                               0         6.32
         For a plot of XD = 0.750, slope = 0.7875, read xw at the   Checking:
       equilibrium line for each theoretical tray and plot similar
       to Figure 8-38. Then determine the area under the curve
       between the selected xw and the product XD. Then:


                                                             e = 6.31 hours

                                                             where  D  = distillate rate, moles/hr
                                                                   L  = liquid flow, moles/hr
       For this example, In  (Wi/W)  = approximately 0.210         V  = vapor rate, moles/hr
       Then, Wi/W  = 1.2336                                        -
                                                                   V = quantity of vapor, moles
                                                                  W = contents of still pot, moles
       w=-- 510'69 - 413.98 mols bottoms for xw = 0.085            x  = mole fraction of substance in liquid
           1.2336                                                  y  = mole fraction of substance in vapor
                                                                   a  = relative volatility
                                       wixi - wxw                  0  = time, hr
       Average overhead composition, XD avg =
                                         wi -w
                                                             Subscripts
                           - [(510.69) (0.187) - (413.98) (0.085)l
                           -
                                    (510.69 - 413.98)              D = relating to distillate
                                                                   i = initial
                      XD   = 0.6236                                w = relating to pot liquors
   58   59   60   61   62   63   64   65   66   67   68