
Page 163 - Applied Statistics And Probability For Engineers
P. 163
PQ220 6234F.CD(04) 5/13/02 11:55 M Page 1 RK UL 6 RK UL 6:Desktop Folder:TEMP WORK:MONTGOMERY:REVISES UPLO D CH114 FIN L:Quark
4-1
Mean and Variance of the Normal Distribution (CD Only)
In the derivations below, the mean and variance of a normal random variable are shown
2
to be and , respectively. The mean of x is
1x 2 2 2
2
e
E1X2 x dx
22
By making the change of variable y 1x 2 , the integral becomes
y 2 y 2
2
2
e e
E1X2 dy
y dy
22 22
2
e y 2
The first integral in the expression above equals 1 because is a probability density
22
function and the second integral is found to be 0 by either formally making the change of vari-
2
able u y 2 or noticing the symmetry of the integrand about y 0. Therefore, E(X) .
The variance of X is
1x 2 2 2
2
2 e
V1X2 1x 2 dx
22
By making the change of variable y 1x 2 , the integral becomes
y 2
2 e
2
2
V1X2 y dy
22
2
e y 2 2
Upon integrating by parts with u y and dv y dy, V(X) is found to be .
22
4-8 CONTINUITY CORRECTIONS TO IMPROVE
THE APPROXIMATION
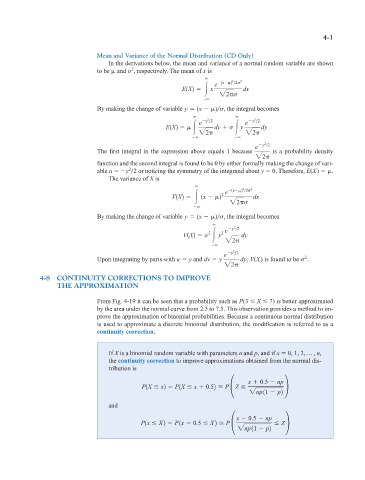
From Fig. 4-19 it can be seen that a probability such as P(3 X 7) is better approximated
by the area under the normal curve from 2.5 to 7.5. This observation provides a method to im-
prove the approximation of binomial probabilities. Because a continuous normal distribution
is used to approximate a discrete binomial distribution, the modification is referred to as a
continuity correction.
If X is a binomial random variable with parameters n and p, and if x 0, 1, 2, p , n,
the continuity correction to improve approximations obtained from the normal dis-
tribution is
x
0.5 np
P1X x2 P1X x
0.52 P °Z ¢
2np 11 p2
and
x 0.5 np
P1x X2 P 1x 0.5 X2 P ° Z¢
2np 11 p2