
Page 260 - Applied Statistics And Probability For Engineers
P. 260
PQ220 6234F.CD(06) 5/14/02 1:26 PM Page 2 RK UL 6 RK UL 6:Desktop Folder:TEMP WORK:MONTGOMERY:REVISES UPLO D CH114 FIN L:Quark F
6-2
Exponential probability plot
ML estimates
99 ML estimates
Mean 20.7362
98
97
Goodness of fit
AD* 0.692
95
Percentage 90
80
70
60
50
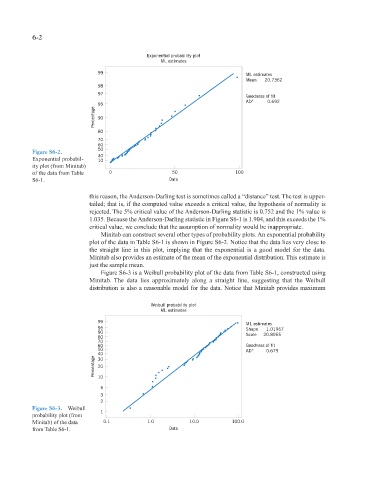
Figure S6-2.
30
Exponential probabil- 10
ity plot (from Minitab)
of the data from Table 0 50 100
S6-1. Data
this reason, the Anderson-Darling test is sometimes called a “distance” test. The test is upper-
tailed; that is, if the computed value exceeds a critical value, the hypothesis of normality is
rejected. The 5% critical value of the Anderson-Darling statistic is 0.752 and the 1% value is
1.035. Because the Anderson-Darling statistic in Figure S6-1 is 1.904, and this exceeds the 1%
critical value, we conclude that the assumption of normality would be inappropriate.
Minitab can construct several other types of probability plots. An exponential probability
plot of the data in Table S6-1 is shown in Figure S6-2. Notice that the data lies very close to
the straight line in this plot, implying that the exponential is a good model for the data.
Minitab also provides an estimate of the mean of the exponential distribution. This estimate is
just the sample mean.
Figure S6-3 is a Weibull probability plot of the data from Table S6-1, constructed using
Minitab. The data lies approximately along a straight line, suggesting that the Weibull
distribution is also a reasonable model for the data. Notice that Minitab provides maximum
Weibull probability plot
ML estimates
99
ML estimates
95 Shape 1.01967
90 Scale 20.8955
80
70
60 Goodness of fit
50 AD* 0.679
40
Percentage 20
30
10
5
3
2
Figure S6-3. Weibull
1
probability plot (from
Minitab) of the data 0.1 1.0 10.0 100.0
from Table S6-1. Data