
Page 257 - Applied Statistics And Probability For Engineers
P. 257
c06.qxd 5/14/02 9:57 M Page 218 RK UL 6 RK UL 6:Desktop Folder:TEMP WORK:MONTGOMERY:REVISES UPLO D CH114 FIN L:Quark Files:
218 CHAPTER 6 RANDOM SAMPLING AND DATA DESCRIPTION
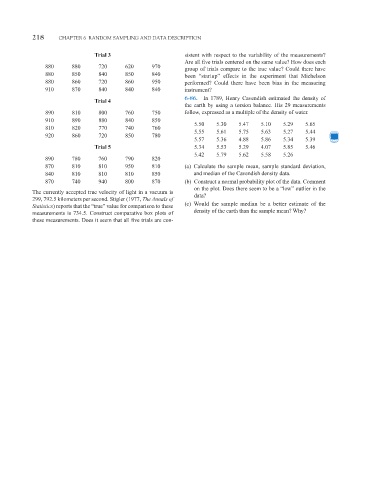
Trial 3 sistent with respect to the variability of the measurements?
Are all five trials centered on the same value? How does each
880 880 720 620 970
group of trials compare to the true value? Could there have
880 850 840 850 840 been “startup” effects in the experiment that Michelson
880 860 720 860 950 performed? Could there have been bias in the measuring
910 870 840 840 840 instrument?
6-86. In 1789, Henry Cavendish estimated the density of
Trial 4
the earth by using a torsion balance. His 29 measurements
890 810 800 760 750 follow, expressed as a multiple of the density of water.
910 890 880 840 850
5.50 5.30 5.47 5.10 5.29 5.65
810 820 770 740 760
5.55 5.61 5.75 5.63 5.27 5.44
920 860 720 850 780
5.57 5.36 4.88 5.86 5.34 5.39
Trial 5 5.34 5.53 5.29 4.07 5.85 5.46
5.42 5.79 5.62 5.58 5.26
890 780 760 790 820
870 810 810 950 810 (a) Calculate the sample mean, sample standard deviation,
840 810 810 810 850 and median of the Cavendish density data.
870 740 940 800 870 (b) Construct a normal probability plot of the data. Comment
on the plot. Does there seem to be a “low” outlier in the
The currently accepted true velocity of light in a vacuum is
data?
299, 792.5 kilometers per second. Stigler (1977, The Annals of
(c) Would the sample median be a better estimate of the
Statistics) reports that the “true” value for comparison to these
density of the earth than the sample mean? Why?
measurements is 734.5. Construct comparative box plots of
these measurements. Does it seem that all five trials are con-