
Page 285 - Applied Statistics And Probability For Engineers
P. 285
c07.qxd 5/15/02 10:18 M Page 243 RK UL 6 RK UL 6:Desktop Folder:TEMP WORK:MONTGOMERY:REVISES UPLO D CH114 FIN L:Quark Files:
7-5 SAMPLING DISTRIBUTIONS OF MEANS 243
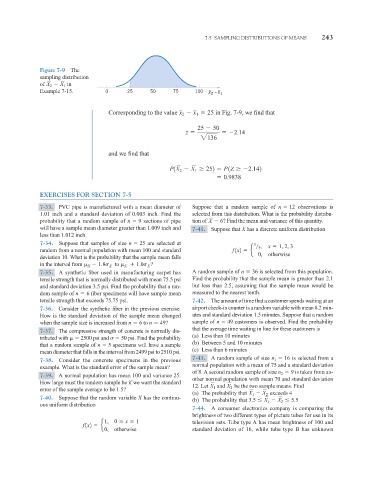
Figure 7-9 The
sampling distribution
in
of X 2 X 1
Example 7-15. 0 25 50 75 100 x – x 1
2
Corresponding to the value x x 25 in Fig. 7-9, we find that
1
2
25 50
z 2.14
2136
and we find that
X
252 P 1Z
2.142
P1X 2 1
0.9838
EXERCISES FOR SECTION 7-5
7-33. PVC pipe is manufactured with a mean diameter of Suppose that a random sample of n 12 observations is
1.01 inch and a standard deviation of 0.003 inch. Find the selected from this distribution. What is the probability distribu-
probability that a random sample of n 9 sections of pipe tion of X 6? Find the mean and variance of this quantity.
will have a sample mean diameter greater than 1.009 inch and 7-41. Suppose that X has a discrete uniform distribution
less than 1.012 inch.
7-34. Suppose that samples of size n 25 are selected at 1 x 1, 2, 3
random from a normal population with mean 100 and standard f 1x2 e 3 ,
0, otherwise
deviation 10. What is the probability that the sample mean falls
in the interval from X 1.8 X to X 1.0 X ?
7-35. A synthetic fiber used in manufacturing carpet has A random sample of n 36 is selected from this population.
tensile strength that is normally distributed with mean 75.5 psi Find the probability that the sample mean is greater than 2.1
and standard deviation 3.5 psi. Find the probability that a ran- but less than 2.5, assuming that the sample mean would be
dom sample of n 6 fiber specimens will have sample mean measured to the nearest tenth.
tensile strength that exceeds 75.75 psi. 7-42. The amount of time that a customer spends waiting at an
7-36. Consider the synthetic fiber in the previous exercise. airport check-in counter is a random variable with mean 8.2 min-
How is the standard deviation of the sample mean changed utes and standard deviation 1.5 minutes. Suppose that a random
when the sample size is increased from n 6 to n 49? sample of n 49 customers is observed. Find the probability
7-37. The compressive strength of concrete is normally dis- that the average time waiting in line for these customers is
tributed with 2500 psi and 50 psi. Find the probability (a) Less than 10 minutes
that a random sample of n 5 specimens will have a sample (b) Between 5 and 10 minutes
mean diameter that falls in the interval from 2499 psi to 2510 psi. (c) Less than 6 minutes
7-43. A random sample of size n 1 16 is selected from a
7-38. Consider the concrete specimens in the previous
example. What is the standard error of the sample mean? normal population with a mean of 75 and a standard deviation
of 8. A second random sample of size n 2 9 is taken from an-
7-39. A normal population has mean 100 and variance 25.
other normal population with mean 70 and standard deviation
How large must the random sample be if we want the standard
12. Let X 1 and X 2 be the two sample means. Find
error of the sample average to be 1.5?
(a) The probability that X 1 X 2 exceeds 4
7-40. Suppose that the random variable X has the continu-
(b) The probability that 3.5 X 1 X 2 5.5
ous uniform distribution
7-44. A consumer electronics company is comparing the
brightness of two different types of picture tubes for use in its
1, 0 x 1 television sets. Tube type A has mean brightness of 100 and
f 1x2 e
0, otherwise standard deviation of 16, while tube type B has unknown