
Page 282 - Applied Statistics And Probability For Engineers
P. 282
c07.qxd 5/15/02 10:18 M Page 240 RK UL 6 RK UL 6:Desktop Folder:TEMP WORK:MONTGOMERY:REVISES UPLO D CH114 FIN L:Quark Files:
240 CHAPTER 7 POINT ESTIMATION OF PARAMETERS
2
variance n , if the sample size n is large. This is one of the most useful theorems in statis-
tics, called the central limit theorem. The statement is as follows:
Theorem 7-2:
The Central If X , X , p , X is a random sample of size n taken from a population (either finite
1
n
2
2
Limit Theorem or infinite) with mean and finite variance , and if X is the sample mean, the lim-
iting form of the distribution of
X
Z (7-6)
1n
as n S , is the standard normal distribution.
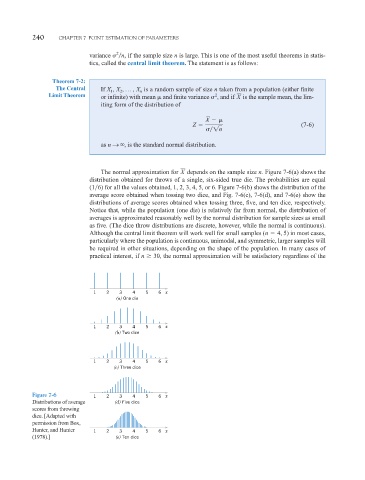
The normal approximation for X depends on the sample size n. Figure 7-6(a) shows the
distribution obtained for throws of a single, six-sided true die. The probabilities are equal
(1 6) for all the values obtained, 1, 2, 3, 4, 5, or 6. Figure 7-6(b) shows the distribution of the
average score obtained when tossing two dice, and Fig. 7-6(c), 7-6(d), and 7-6(e) show the
distributions of average scores obtained when tossing three, five, and ten dice, respectively.
Notice that, while the population (one die) is relatively far from normal, the distribution of
averages is approximated reasonably well by the normal distribution for sample sizes as small
as five. (The dice throw distributions are discrete, however, while the normal is continuous).
Although the central limit theorem will work well for small samples (n 4, 5) in most cases,
particularly where the population is continuous, unimodal, and symmetric, larger samples will
be required in other situations, depending on the shape of the population. In many cases of
practical interest, if n
30, the normal approximation will be satisfactory regardless of the
1 2 3 4 5 6 x
(a) One die
1 2 3 4 5 6 x
(b) Two dice
1 2 3 4 5 6 x
(c) Three dice
Figure 7-6 1 2 3 4 5 6 x
Distributions of average (d) Five dice
scores from throwing
dice. [Adapted with
permission from Box,
Hunter, and Hunter 1 2 3 4 5 6 x
(1978).] (e) Ten dice