
Page 278 - Applied Statistics And Probability For Engineers
P. 278
c07.qxd 5/15/02 10:18 M Page 236 RK UL 6 RK UL 6:Desktop Folder:TEMP WORK:MONTGOMERY:REVISES UPLO D CH114 FIN L:Quark Files:
236 CHAPTER 7 POINT ESTIMATION OF PARAMETERS
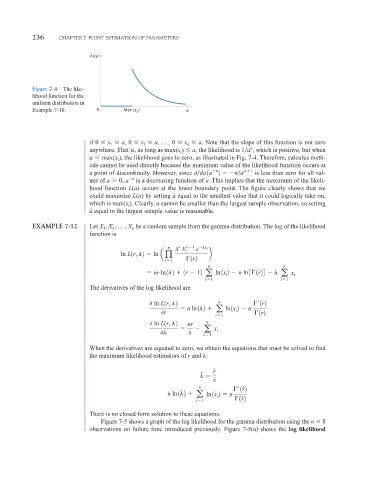
L(a)
Figure 7-4 The like-
lihood function for the
uniform distribution in
Example 7-10. 0 Max (x ) a
i
if 0 x a, 0 x a, p , 0 x a. Note that the slope of this function is not zero
2
1
n
anywhere. That is, as long as max(x ) a, the likelihood is 1 a n , which is positive, but when
i
a max(x ), the likelihood goes to zero, as illustrated in Fig. 7-4. Therefore, calculus meth-
i
ods cannot be used directly because the maximum value of the likelihood function occurs at
n n 1
a point of discontinuity. However, since d da 1a 2 n a is less than zero for all val-
ues of a 0, a n is a decreasing function of a. This implies that the maximum of the likeli-
hood function L(a) occurs at the lower boundary point. The figure clearly shows that we
could maximize L(a) by setting equal to the smallest value that it could logically take on,
a ˆ
which is max(x ). Clearly, a cannot be smaller than the largest sample observation, so setting
i
a ˆ equal to the largest sample value is reasonable.
EXAMPLE 7-12 Let X , X , p , X be a random sample from the gamma distribution. The log of the likelihood
n
1
2
function is
r
n X i r 1 x i
e
ln L1r, 2 ln a q b
i 1 1r2
n n
nr ln 1 2 1r 12 a ln 1x 2 n ln 3 1r24 a x i
i
i 1 i 1
The derivatives of the log likelihood are
ln L1r, 2 n ¿ 1r2
n ln 1 2 ln1x i 2 n
r a 1r2
i 1
ln L1r, 2 nr n
a x
i
i 1
When the derivatives are equated to zero, we obtain the equations that must be solved to find
the maximum likelihood estimators of r and :
r ˆ
ˆ
x
n ¿ 1r ˆ2
ˆ
n ln 1 2 a ln 1x 2 n
i
i 1 1r ˆ2
There is no closed form solution to these equations.
Figure 7-5 shows a graph of the log likelihood for the gamma distribution using the n 8
observations on failure time introduced previously. Figure 7-5(a) shows the log likelihood