
Page 283 - Applied Statistics And Probability For Engineers
P. 283
c07.qxd 5/15/02 10:18 M Page 241 RK UL 6 RK UL 6:Desktop Folder:TEMP WORK:MONTGOMERY:REVISES UPLO D CH114 FIN L:Quark Files:
7-5 SAMPLING DISTRIBUTIONS OF MEANS 241
shape of the population. If n 30, the central limit theorem will work if the distribution of the
population is not severely nonnormal.
EXAMPLE 7-13 An electronics company manufactures resistors that have a mean resistance of 100 ohms and
a standard deviation of 10 ohms. The distribution of resistance is normal. Find the probability
that a random sample of n 25 resistors will have an average resistance less than 95 ohms.
Note that the sampling distribution of X is normal, with mean 100 ohms and a
X
standard deviation of
10
2
X
1n 125
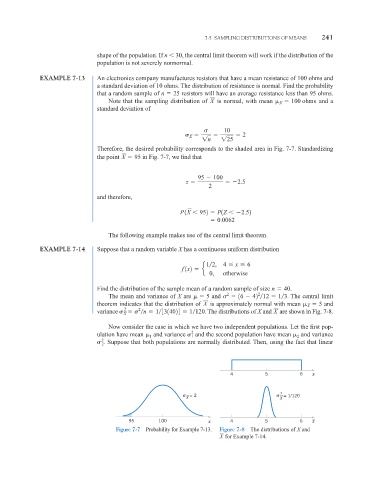
Therefore, the desired probability corresponds to the shaded area in Fig. 7-7. Standardizing
the point X 95 in Fig. 7-7, we find that
95 100
z 2.5
2
and therefore,
P 1X 952 P1Z 2.52
0.0062
The following example makes use of the central limit theorem.
EXAMPLE 7-14 Suppose that a random variable X has a continuous uniform distribution
1 2, 4 x 6
f 1x2 e
0, otherwise
Find the distribution of the sample mean of a random sample of size n 40.
2
2
The mean and variance of X are 5 and 16 42 12 1 3 . The central limit
theorem indicates that the distribution of X is approximately normal with mean 5 and
X
2
variance 2 n 1 3314024 1 120 . The distributions of X and are shown in Fig. 7-8.
X
X
Now consider the case in which we have two independent populations. Let the first pop-
2
ulation have mean and variance 1 and the second population have mean and variance
2
1
2
. Suppose that both populations are normally distributed. Then, using the fact that linear
2
4 5 6 x
σ = 2 σ 2 = 1/120
X X
95 100 x 4 5 6 x
Figure 7-7 Probability for Example 7-13. Figure 7-8 The distributions of X and
X for Example 7-14.