Page 279 - Applied Statistics And Probability For Engineers
P. 279

c07.qxd  5/15/02  10:18  M  Page 237 RK UL 6 RK UL 6:Desktop Folder:TEMP WORK:MONTGOMERY:REVISES UPLO D CH114 FIN L:Quark Files:


                                                                        7-3 METHODS OF POINT ESTIMATION   237


                   –31.94
                                                                 0.087
                   –31.96                                               –32.106
                    –31.98                                       0.085  –32.092
                   Log likelihood  –32.02                        0.083  –32.064
                                                                        –32.078
                    –32.00
                    –32.04
                                                                        –32.05
                    –32.06
                    –32.08                                     λ  0.081  –32.036               –31.997
                    –32.10                                              –32.022
                     0.087                                       0.079  –32.009
                                                         1.86
                       0.085                           1.82
                          0.083                      1.78               –31.995
                           λ  0.081             1.70 1.74        0.077
                               0.079         1.66  r
                                 0.077
                                           1.62                  0.075
                                    0.075 1.58
                                                                    1.58  1.62  1.66  1.70  1.74  1.78  1.82  1.86
                                                                                         r
                                       (a)                                              (b)
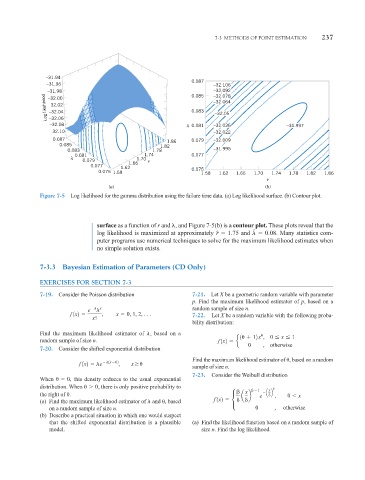
                 Figure 7-5  Log likelihood for the gamma distribution using the failure time data. (a) Log likelihood surface. (b) Contour plot.


                                   surface as a function of r and  , and Figure 7-5(b) is a contour plot. These plots reveal that the
                                                                                    ˆ
                                   log likelihood is maximized at approximately r ˆ   1.75  and     0.08 . Many statistics com-
                                   puter programs use numerical techniques to solve for the maximum likelihood estimates when
                                   no simple solution exists.

                 7-3.3 Bayesian Estimation of Parameters (CD Only)

                 EXERCISES FOR SECTION 7-3

                 7-19.  Consider the Poisson distribution        7-21.  Let X be a geometric random variable with parameter
                                                                 p. Find the maximum likelihood estimator of p, based on a

                                e    x                           random sample of size n.
                           f  1x2    ,    x   0, 1, 2, . . .     7-22.  Let X be a random variable with the following proba-
                                  x!
                                                                 bility distribution:

                 Find the maximum likelihood estimator of  , based on a
                                                                                1   12 x ,  0   x   1
                 random sample of size n.                                f  1x2   e
                                                                                     0  ,  otherwise
                 7-20.  Consider the shifted exponential distribution
                                                                 Find the maximum likelihood estimator of  , based on a random
                              f  1x2    e    1x  2 ,   x
                                                                 sample of size n.
                                                                 7-23.  Consider the Weibull distribution

                 When    0, this density reduces to the usual exponential
                 distribution. When    0 , there is only positive probability to
                                                                                 x    1  x
                 the right of  .                                                 a b  e   a b  0   x
                                                                                           ,


                 (a) Find the maximum likelihood estimator of  and  , based  f  1x2   •
                    on a random sample of size n.                                  0       ,  otherwise
                 (b) Describe a practical situation in which one would suspect
                    that the shifted exponential distribution is a plausible  (a) Find the likelihood function based on a random sample of
                    model.                                          size n. Find the log likelihood.
   274   275   276   277   278   279   280   281   282   283   284