
Page 311 - Applied Statistics And Probability For Engineers
P. 311
c08.qxd 5/15/02 6:13 PM Page 263 RK UL 6 RK UL 6:Desktop Folder:TEMP WORK:MONTGOMERY:REVISES UPLO D CH114 FIN L:Quark Files:
8-4 CONFIDENCE INTERVAL ON THE VARIANCE AND STANDARD DEVIATION OF A NORMAL POPULATION 263
f (x) f (x)
α 0.05 0.05
0 α, k x 0 2 0.95, 10 2 0.05, 10
2
= 3.94 = 18.31
(a) (b)
2
2
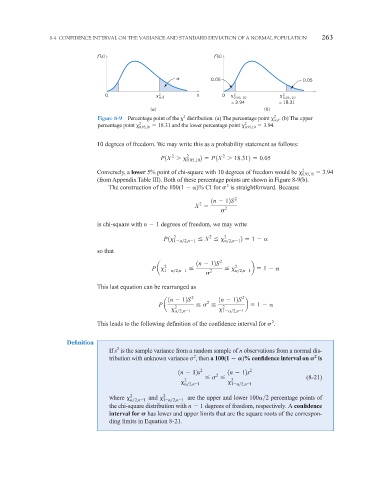
Figure 8-9 Percentage point of the distribution. (a) The percentage point ,k . (b) The upper
2
2
percentage point 0.05,10 18.31 and the lower percentage point 0.95,10 3.94.
10 degrees of freedom. We may write this as a probability statement as follows:
2
2
2
P1X
0.05,10 2 P1X
18.312 0.05
Conversely, a lower 5% point of chi-square with 10 degrees of freedom would be 2 0.95,10 3.94
(from Appendix Table III). Both of these percentage points are shown in Figure 8-9(b).
2
The construction of the 100(1 )% CI for is straightforward. Because
2
1n 12S
2
X
2
is chi-square with n 1 degrees of freedom, we may write
2 2 2
P 1 1 2,n 1 X 2,n 1 2 1
so that
2
1n 12S 2
2
P a b 1
1 2,n 1 2 2,n 1
This last equation can be rearranged as
1n 12S 2 1n 12S 2
2
P a b 1
2 2
2,n 1 1 2,n 1
2
This leads to the following definition of the confidence interval for .
Definition
2
If s is the sample variance from a random sample of n observations from a normal dis-
2
2
tribution with unknown variance , then a 100(1 )% confidence interval on is
1n 12s 2 1n 12s 2
2
(8-21)
2 2,n 1 2 1 2,n 1
where 2 2,n 1 and 2 1 2,n 1 are the upper and lower 100 2 percentage points of
the chi-square distribution with n 1 degrees of freedom, respectively. A confidence
interval for has lower and upper limits that are the square roots of the correspon-
ding limits in Equation 8-21.