
Page 346 - Applied Statistics And Probability For Engineers
P. 346
c09.qxd 5/15/02 8:02 PM Page 294 RK UL 9 RK UL 9:Desktop Folder:
294 CHAPTER 9 TESTS OF HYPOTHESES FOR A SINGLE SAMPLE
µ
µ
Under H : = µ Under H : ≠
µ
0 0 1 0
δ
√n
N(0,1) N σ ( , 1 (
β
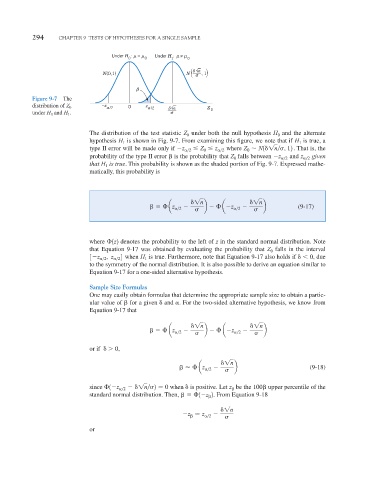
Figure 9-7 The
–z z
δ
distribution of Z 0 /2α 0 α √n Z 0
/2
under H 0 and H 1 . σ
The distribution of the test statistic Z under both the null hypothesis H 0 and the alternate
0
hypothesis H 1 is shown in Fig. 9-7. From examining this figure, we note that if H 1 is true, a
type II error will be made only if
z
2 Z z
2 where Z N1 1n
, 12 . That is, the
0
0
probability of the type II error is the probability that Z 0 falls between
z
2 and z
2 given
that H 1 is true. This probability is shown as the shaded portion of Fig. 9-7. Expressed mathe-
matically, this probability is
1n 1n
az
2
b
a
z
2
b (9-17)
where 1z2 denotes the probability to the left of z in the standard normal distribution. Note
that Equation 9-17 was obtained by evaluating the probability that Z 0 falls in the interval
3
z
2 , z
2 4 when H 1 is true. Furthermore, note that Equation 9-17 also holds if 0 , due
to the symmetry of the normal distribution. It is also possible to derive an equation similar to
Equation 9-17 for a one-sided alternative hypothesis.
Sample Size Formulas
One may easily obtain formulas that determine the appropriate sample size to obtain a partic-
ular value of for a given and . For the two-sided alternative hypothesis, we know from
Equation 9-17 that
1n 1n
az
2
b
a
z
2
b
or if 0,
1n
az
2
b (9-18)
since 1
z
2
1n
2 0 when is positive. Let z be the 100 upper percentile of the
standard normal distribution. Then, 1
z 2 . From Equation 9-18
1n
z
z
2
or