Page 347 - Applied Statistics And Probability For Engineers
P. 347
c09.qxd  5/15/02  8:02 PM  Page 295 RK UL 9 RK UL 9:Desktop Folder:


                                           9-2 TESTS ON THE MEAN OF A NORMAL DISTRIBUTION, VARIANCE KNOWN  295


                                                                             2  2
                                                                     1z
 2    z 2

                                                                 n                                   (9-19)
                                                                            2
                                       where

      0


                                   This approximation is good when  1
z
 2
 1n
 2  is small compared to  . For either of
                                   the one-sided alternative hypotheses the sample size required to produce a specified type II
                                   error with probability   given   and 	 is


                                                                             2
                                                                     1z   z 2    2


                                                                 n                                   (9-20)
                                                                            2
                                       where

      0


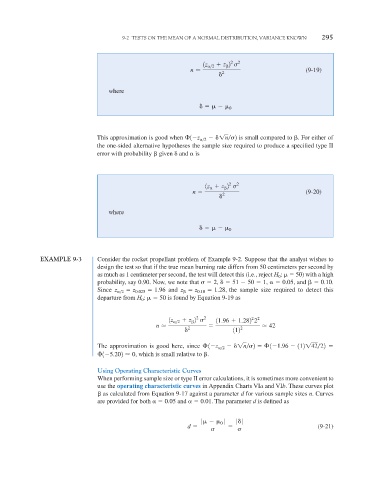
                 EXAMPLE 9-3       Consider the rocket propellant problem of Example 9-2. Suppose that the analyst wishes to
                                   design the test so that if the true mean burning rate differs from 50 centimeters per second by
                                   as much as 1 centimeter per second, the test will detect this (i.e., reject H :    50) with a high
                                                                                            0
                                   probability, say 0.90. Now, we note that    2,    51
 50   1, 	  0.05, and    0.10.
                                   Since  z
 2    z 0.025    1.96  and  z   z 0.10    1.28,  the sample size required to detect this

                                   departure from H 0 :    50 is found by Equation 9-19 as

                                                                  2
                                                                                    2  2
                                                          1z
 2    z 2    2  11.96   1.282 2

                                                      n                                  42
                                                                 2            112 2
                                   The approximation is good here, since    1
z
 2
 1n
 2    1
1.96
 112142
22
                                    1
5.202   0,  which is small relative to  .


                                   Using Operating Characteristic Curves
                                   When performing sample size or type II error calculations, it is sometimes more convenient to
                                   use the operating characteristic curves in Appendix Charts VIa and VIb. These curves plot
                                     as calculated from Equation 9-17 against a parameter d for various sample sizes n. Curves
                                   are provided for both 	  0.05 and 	  0.01. The parameter d is defined as


                                                                           0   0  0
                                                                    0
  0
                                                                d                                        (9-21)

