
Page 351 - Applied Statistics And Probability For Engineers
P. 351
c09.qxd 5/15/02 8:02 PM Page 299 RK UL 9 RK UL 9:Desktop Folder:
9-2 TESTS ON THE MEAN OF A NORMAL DISTRIBUTION, VARIANCE KNOWN 299
is close to 50.5 centimeters per second, and we would not want this value of from the sam-
x
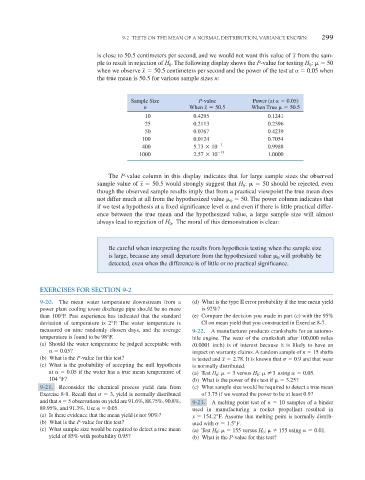
ple to result in rejection of H . The following display shows the P-value for testing H 0 : 50
0
when we observe x 50.5 centimeters per second and the power of the test at 0.05 when
the true mean is 50.5 for various sample sizes n:
Sample Size P-value Power (at 0.05)
n When x 50.5 When True 50.5
10 0.4295 0.1241
25 0.2113 0.2396
50 0.0767 0.4239
100 0.0124 0.7054
400 5.73 10
7 0.9988
1000 2.57 10
15 1.0000
The P-value column in this display indicates that for large sample sizes the observed
sample value of x 50.5 would strongly suggest that H : 50 should be rejected, even
0
though the observed sample results imply that from a practical viewpoint the true mean does
not differ much at all from the hypothesized value 50. The power column indicates that
0
if we test a hypothesis at a fixed significance level and even if there is little practical differ-
ence between the true mean and the hypothesized value, a large sample size will almost
always lead to rejection of H . The moral of this demonstration is clear:
0
Be careful when interpreting the results from hypothesis testing when the sample size
is large, because any small departure from the hypothesized value will probably be
0
detected, even when the difference is of little or no practical significance.
EXERCISES FOR SECTION 9-2
9-20. The mean water temperature downstream from a (d) What is the type II error probability if the true mean yield
power plant cooling tower discharge pipe should be no more is 92%?
than 100°F. Past experience has indicated that the standard (e) Compare the decision you made in part (c) with the 95%
deviation of temperature is 2°F. The water temperature is CI on mean yield that you constructed in Exercise 8-7.
measured on nine randomly chosen days, and the average 9-22. A manufacturer produces crankshafts for an automo-
temperature is found to be 98°F. bile engine. The wear of the crankshaft after 100,000 miles
(a) Should the water temperature be judged acceptable with (0.0001 inch) is of interest because it is likely to have an
0.05? impact on warranty claims. A random sample of n 15 shafts
(b) What is the P-value for this test? is tested and 2.78. It is known that 0.9 and that wear
x
(c) What is the probability of accepting the null hypothesis is normally distributed.
at 0.05 if the water has a true mean temperature of (a) Test H 0 : 3 versus H 0 : Z 3 using 0.05.
104 °F? (b) What is the power of this test if 3.25?
9-21. Reconsider the chemical process yield data from (c) What sample size would be required to detect a true mean
Exercise 8-9. Recall that 3, yield is normally distributed of 3.75 if we wanted the power to be at least 0.9?
and that n 5 observations on yield are 91.6%, 88.75%, 90.8%, 9-23. A melting point test of n 10 samples of a binder
89.95%, and 91.3%. Use 0.05. used in manufacturing a rocket propellant resulted in
(a) Is there evidence that the mean yield is not 90%? x 154.2 F. Assume that melting point is normally distrib-
(b) What is the P-value for this test? uted with 1.5 F .
(c) What sample size would be required to detect a true mean (a) Test H 0 : 155 versus H 0 : 155 using 0.01.
yield of 85% with probability 0.95? (b) What is the P-value for this test?