
Page 354 - Applied Statistics And Probability For Engineers
P. 354
c09.qxd 5/15/02 8:02 PM Page 302 RK UL 9 RK UL 9:Desktop Folder:
302 CHAPTER 9 TESTS OF HYPOTHESES FOR A SINGLE SAMPLE
EXAMPLE 9-6 The increased availability of light materials with high strength has revolutionized the design and
manufacture of golf clubs, particularly drivers. Clubs with hollow heads and very thin faces can
result in much longer tee shots, especially for players of modest skills. This is due partly to the
“spring-like effect” that the thin face imparts to the ball. Firing a golf ball at the head of the club
and measuring the ratio of the outgoing velocity of the ball to the incoming velocity can quantify
this spring-like effect. The ratio of velocities is called the coefficient of restitution of the club. An
experiment was performed in which 15 drivers produced by a particular club maker were selected
at random and their coefficients of restitution measured. In the experiment the golf balls were
fired from an air cannon so that the incoming velocity and spin rate of the ball could be precisely
controlled. It is of interest to determine if there is evidence (with 0.05) to support a claim that
the mean coefficient of restitution exceeds 0.82. The observations follow:
0.8411 0.8191 0.8182 0.8125 0.8750
0.8580 0.8532 0.8483 0.8276 0.7983
0.8042 0.8730 0.8282 0.8359 0.8660
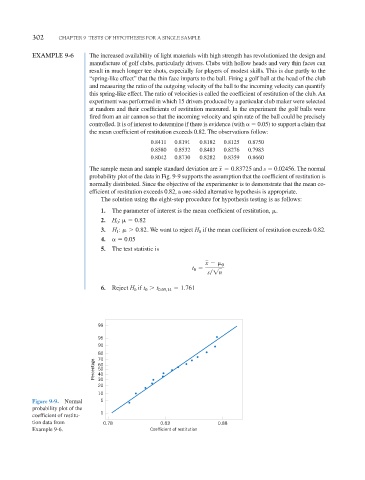
The sample mean and sample standard deviation are x 0.83725 and s 0.02456. The normal
probability plot of the data in Fig. 9-9 supports the assumption that the coefficient of restitution is
normally distributed. Since the objective of the experimenter is to demonstrate that the mean co-
efficient of restitution exceeds 0.82, a one-sided alternative hypothesis is appropriate.
The solution using the eight-step procedure for hypothesis testing is as follows:
1. The parameter of interest is the mean coefficient of restitution, .
2. H : 0.82
0
3. H : 0.82 . We want to reject H if the mean coefficient of restitution exceeds 0.82.
0
1
4. 0.05
5. The test statistic is
x
0
t
0
s
1n
6. Reject H if t t 0.05,14 1.761
0
0
99
95
90
80
70
Percentage 60
50
40
30
20
10
Figure 9-9. Normal 5
probability plot of the
1
coefficient of restitu-
tion data from 0.78 0.83 0.88
Example 9-6. Coefficient of restitution